. 2022 Feb 8;11:e68648. doi: 10.7554/eLife.68648

Figure 5. Enrichment of S/T-P-X-K phosphorylation motif in the set of ATR and RAD1-dependent signaling events.

(A) Bar graph depicting the count of Q2 phosphopeptides with the indicated amino acids at the +1 position. (B) Bar graph of the percentage of indicated phospho-motifs in the center (unchanged events) and Q2. (C) Immunofluorescence of meiotic spreads from mice treated with vehicle or 50 mg/kg AZ20 for 4 hr and stained for CDK2 (green) and SYCP3 (red). (D) Quantification of CDK2 signal intensity of pachytene-staged cells in (C) (three vehicle mice, n = 60 cells; three ATRi mice, n = 60 cells p=0.0368 measured by Student’s t-test) (see Materials and methods for more details). (E) Chord plot of gene ontology (GO) analysis of ATR and RAD1-dependent S/T-P-X-K phosphorylation events using STRING. The top 10 significantly enriched biological processes GO terms were selected. False discovery rate (FDR) for GO term enrichment is shown below each term. GO terms are shown on the right and proteins found for each term on the left. (F) STRING analysis cluster of piRNA-related proteins with Q2 phosphorylation.

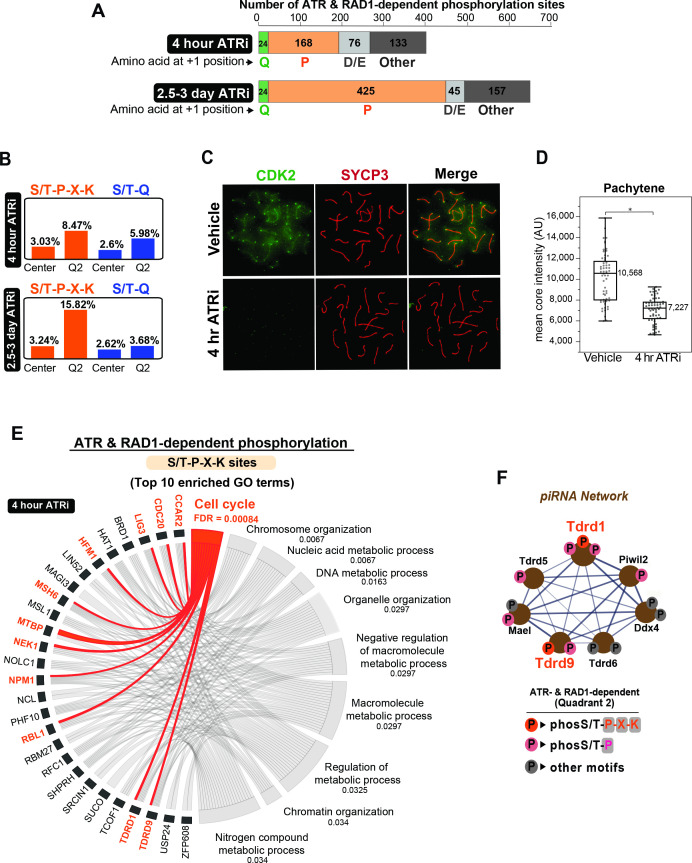
Figure 5.

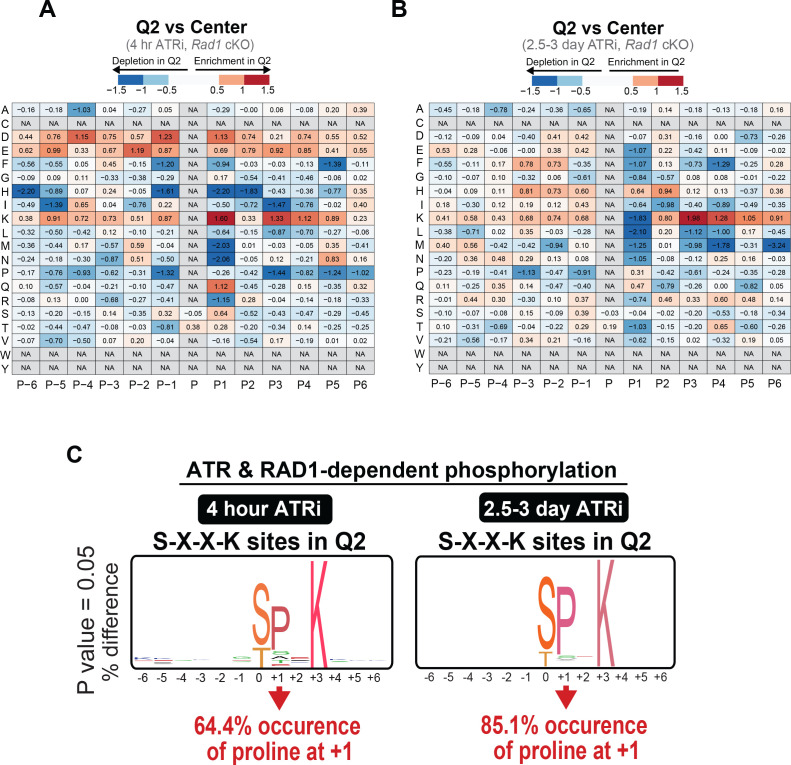
Figure 5—figure supplement 1. RAD1- and ATR-dependent signaling is enriched for phosphorylation events at the S/T-X-X-K motif.

Figure 5—figure supplement 1.

(A) Heat map for the prevalence of amino acids at positions surrounding the phosphorylation sites (P: phosphorylation site position) comparing Q2 phosphopeptides to phosphopeptides found in the center dataset. Amino acids (y axis) were plotted against position (x axis) with fold depletion in Q2 represented by blue and fold enrichment in Q2 represented by red for the 4 hr ATRi treatment. (B) Same as in (A) but for the 2.5–3-day ATRi treatment dataset. (C) Logo graph for relative prevalence of different amino acids in Q2 phosphosites containing a fixed lysine (K) at +3 position.
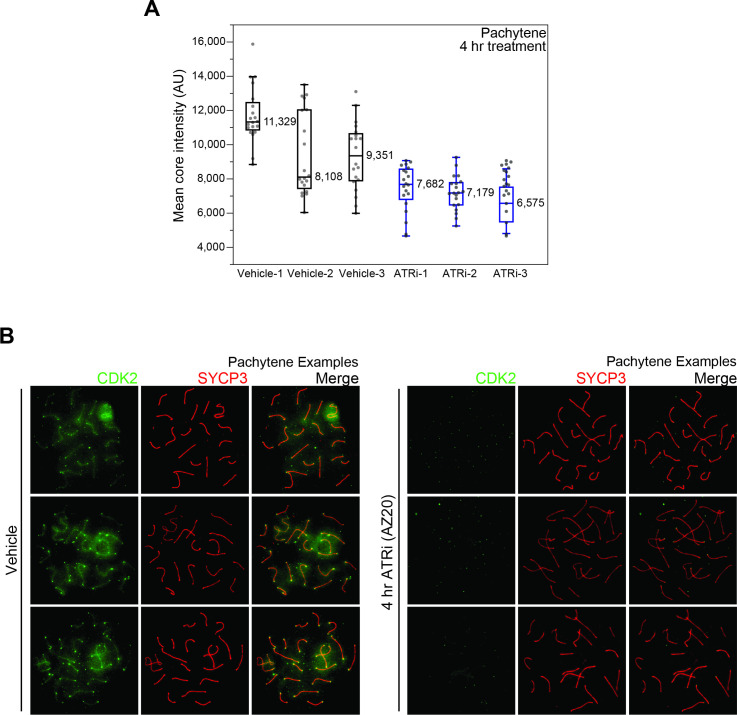
Figure 5—figure supplement 2. Effect of ATRi treatment on the localization of CDK2 in meiotic spreads.

Figure 5—figure supplement 2.

(A) Quantification of autosomal core intensity of CDK2 as shown in Figure 5D, but separated by individual animal replicates. (B) Example pachynema images from vehicle or 4 hr ATRi-treated animals stained with CDK2 (green) and SYCP3 (red).
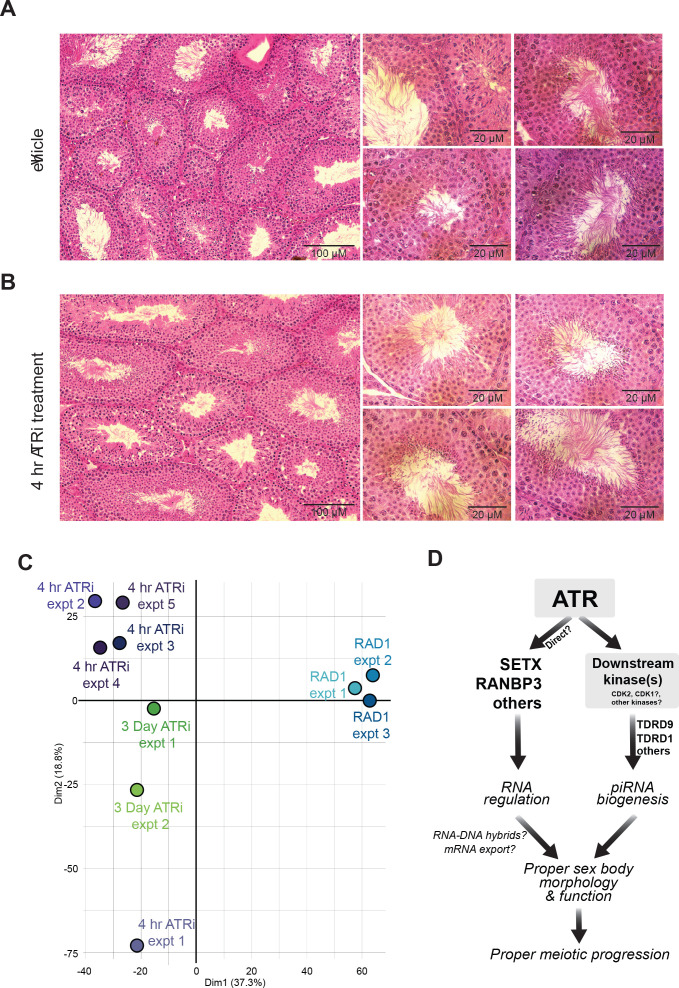
Figure 5—figure supplement 3. Histological and PCA analysis of ATRi treated mice.

Figure 5—figure supplement 3.

(A) Hematoxylin and eosin stained testes tissue sections from vehicle and (B) 50 mg/kg AZ20 (ATRi)-treated mice. (C) Principal component analysis for experimental replicates and conditions. 4 hr ATRi treatments are in purple, 2.5–3-day ATRi experiments in green and Rad1 cKO mice are in blue. (D) Speculative model for the role of ATR signaling in the control of RNA processes and promotion of meiotic progression.