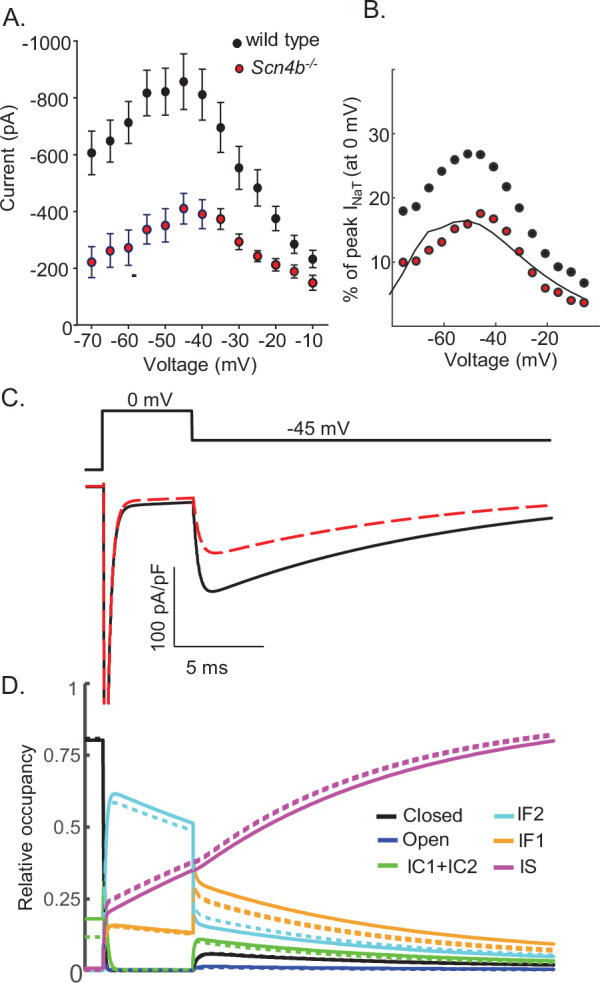
Figure 9. Promoting entry into the slow-inactivated state reduces voltage-gated sodium current (INaR) amplitudes.

(A) Mean ± SEM peak INaR amplitudes, measured on membrane hyperpolarizations following brief depolarizing voltage steps to +10 mV, in wild type (black) and Scn4b-/- (red) mouse cerebellar Purkinje neurons are plotted as a function of membrane voltage are shown (data were reproduced with permission from Ransdell et al., 2017). Peak INaR amplitudes in individual wild type and Scn4b-/- cells were also normalized to peak INaT measured (at 0 mV) in the same cell, and the mean INaR as a percentage of peak INaT in wild type (black) and Scn4b-/- (red) cells are plotted (as points) in (B); the solid line is the normalized relative INaR/INaT generated by the Scn4b-/- model. (C) Consistent with the experimental data, the kinetics of INaR are not affected measurably by the loss of Scn4b (Navβ4) in the model, whereas INaR amplitudes are reduced to ~50% of wild type INaR levels (C). A time-locked plot of the gating state transitions (D) indicates that INaR amplitudes are reduced in the Scn4b-/- model (dashed lines) due to a decrease in IF2 occupancy and an increase in IS occupancy. In this gating state occupancy plot, black represents the closed state, blue represents the open state, green represents the IC1+ IC2 states, aqua represents the IF2 state, orange represents the IF1 state, and purple represents the IS state.
