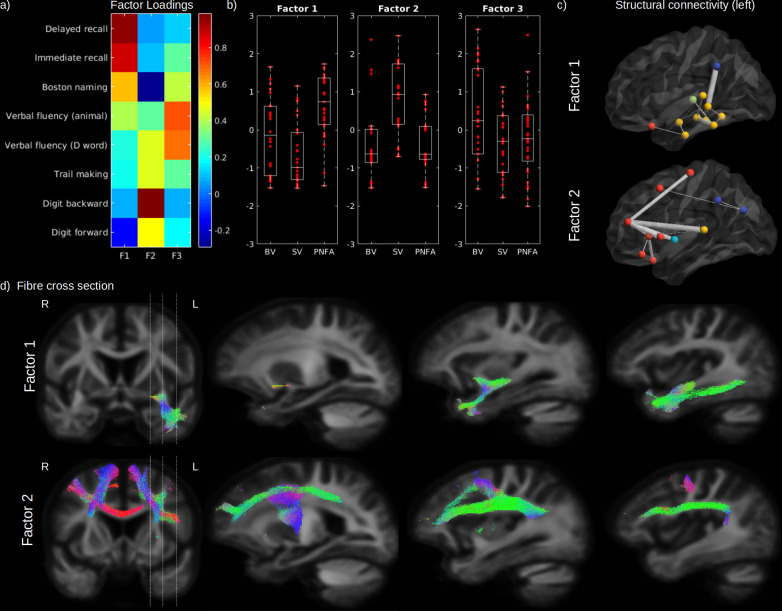
Figure 5. Cognitive domains and white-matter (WM) microstructure.
The factor loadings for the common factor analysis of selected cognitive tests are shown in (a). Associated factors scores are shown in (b) for behavioural variant (BV), semantic variant (SV), and progressive non-fluent aphasia (PNFA), for Factor 1 (semantic processing; left panel), Factor 2 (executive processing; middle panel), and Factor 3 (verbal fluency; right panel). Significantly reduced structural connectivity (across all patients; FWE-corrected p-value < 0.01) is shown in (c) for the Factor 1 (upper panel) and Factor 2 (lower panel), for the ipsilateral left (upper panel) hemisphere connectivity, where frontal regions are shown in red, the insula in light blue, the temporal lobe in yellow, subcortical regions in green and parietal regions in dark blue. The line thickness corresponds to the statistical strength of the effect. Significant relationship (FWE-corrected p-value < 0.05) between the cognitive factors and fibre cross-section (FC) is shown in (d) with associated streamlines (colour coded by direction) for Factor 1 (upper panel) and Factor 2 (lower panel).

