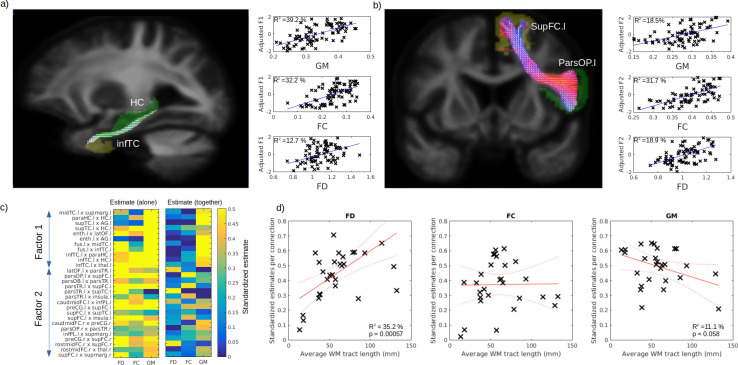
Figure 6. Respective contribution of grey matter (GM) and white matter (WM) to predict cognitive impairment.
Example tract of interest, selected from the significant relationship between structural connectivity and cognitive factor, are shown in (a–b), for Factors 1 and 2, respectively. The pair of connecting cortical regions (green and yellow) and the fixel binary mask extracted from the streamlines connecting the pair of GM regions (white) are used to calculate the connection-specific relationship across subjects between the cognitive factors and the average regional GM volume (upper panel) and the average fibre cross-section (FC) and fibre density (FD) in the fixel binary mask (middle and lower panels, respectively). The standardized estimate of the relationship between the cognitive factors 1 and 2 is shown in (c) for all selected connections, where the left panel shows the values when FD, FC, and GM were used as single predictors and the right panels show the partial estimates when FD, FC, and GM were all included together in the model. The relationship between each connection estimate and their associated average fibre length is shown in (d) for FD (left panel), FC (middle panel), and GM (right panel).

