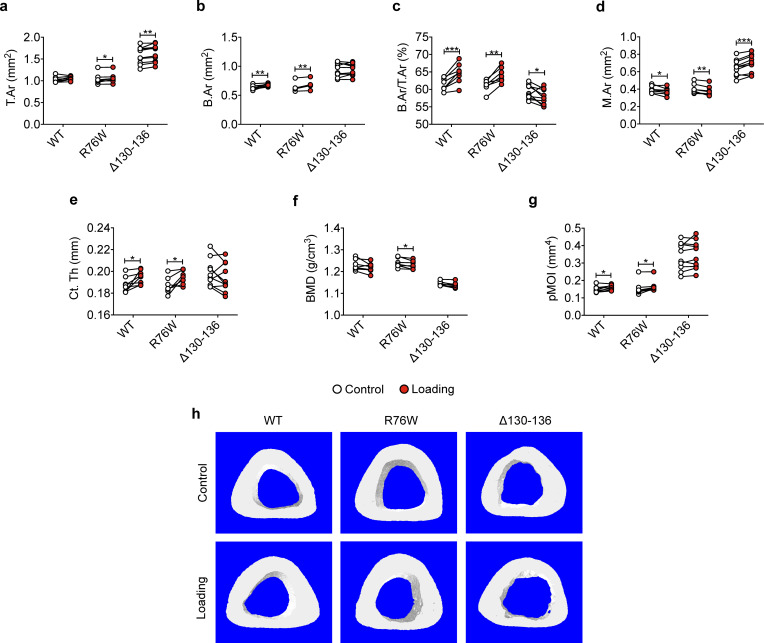
Figure 2. Attenuation or reversal of anabolic responses to mechanical loading in midshaft cortical bone of ∆130–136 mice.
μCT was used to assess tibial midshaft cortical bone (50% site) of WT, R76W, and ∆130–136 mice; (a) total area, (b) bone area, (c) bone area fraction, (d) bone marrow area, (e) cortical thickness, (f) bone mineral density, and (g) polar moment of inertia. n = 7–10/group. (h) Representative 3D models of the tibial midshaft cortical bone for all groups. Data are expressed as mean ± SD. *, p < 0.05; **, p < 0.01; **, p < 0.001. Statistical analysis was performed using paired t-test for loaded and contralateral, unloaded tibias within each genotype.

