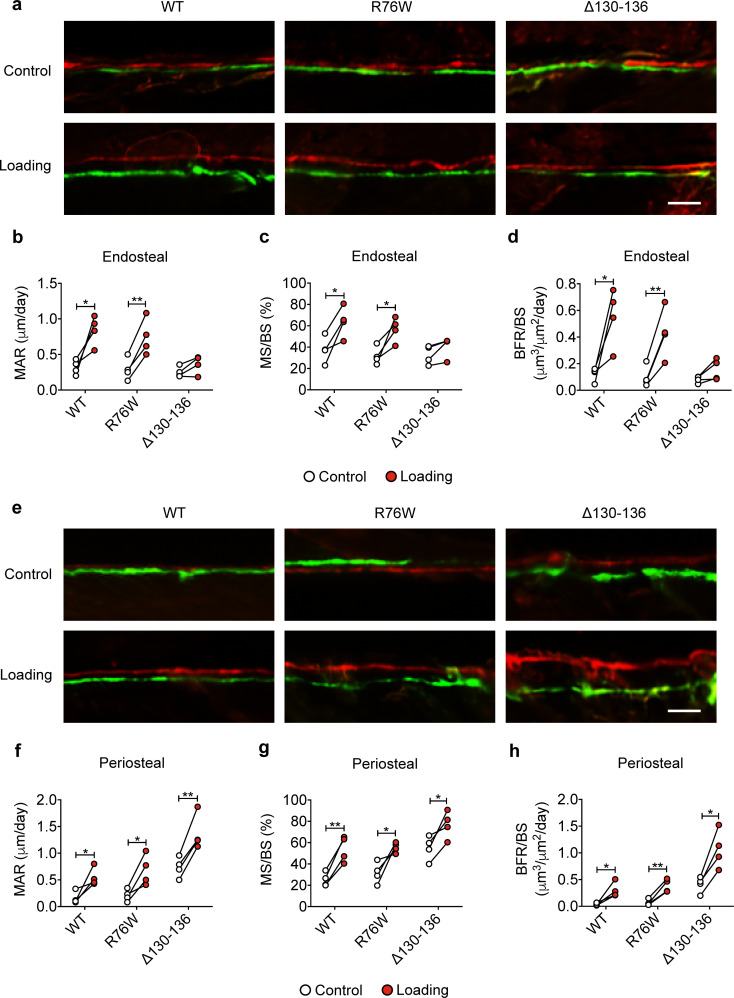
Figure 3. Reduced midshaft endosteal osteogenic responses to mechanical loading in ∆130–136 mice.
Dynamic histomorphometric analyses were performed on the tibial midshaft cortical endosteal and periosteal surfaces after 2 weeks of tibial loading of WT, R76W, and ∆130–136 mice. Representative images of calcein (green) alizarin (red) double labeling on (a) endosteal and (e) periosteal surface. Scale bar: 50 μm. Mineral apposition rate (MAR) (b, f), mineralizing surface/bone surface (MS/BS) (c, g), and bone formation rate (BFR/BS) (d, h) were assessed for endosteal (b–d) and periosteal (f–h) surfaces n = 4/group. Data are expressed as mean ± SD. *, p < 0.05; **, p < 0.01. Statistical analysis was performed using paired t-test for loaded and contralateral, unloaded tibias within each genotype.

