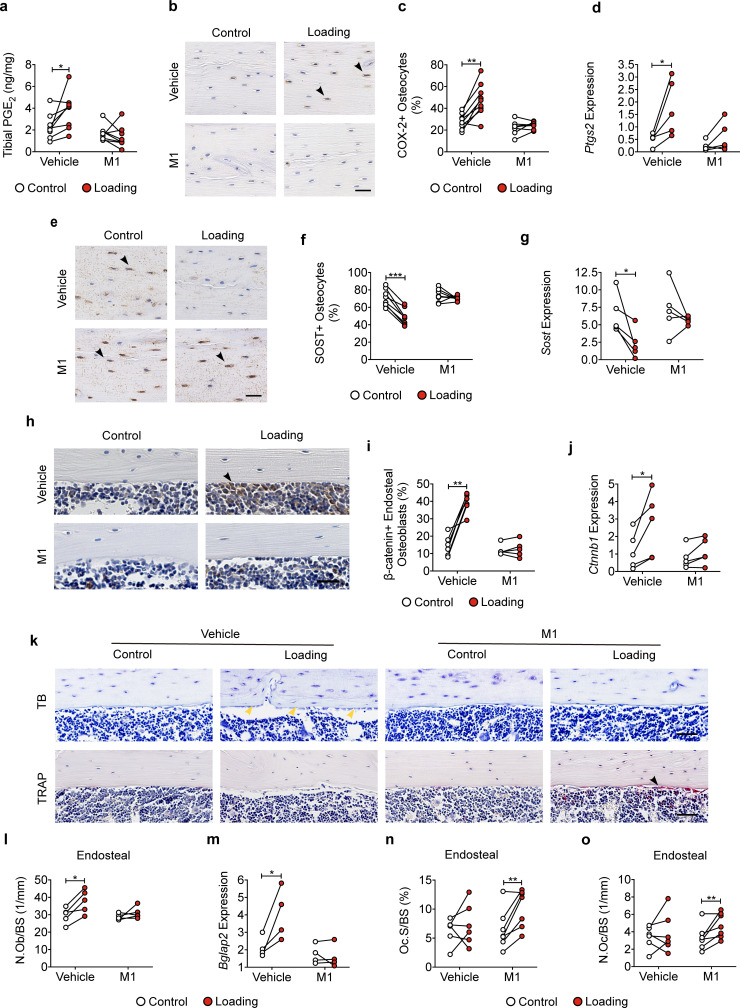
Figure 7. Cx43(M1) impedes the loading-induced increased PGE2 secretion and osteoblast activity, and decreased osteoclast activity.
(a) ELISA analysis of PGE2 in bone marrow-flushed tibial diaphysis after 5 days of mechanical loading in vehicle and Cx43(M1)-treated mice (n = 8/group). (b, c) Representative images and quantitative analysis of COX-2-postive osteocytes (yellow arrows) in tibial midshaft cortical bone after 2 weeks of loading in vehicle and Cx43(M1)-treated mice. Scale bar: 30 μm. n = 8–9/group. (d) Ptgs2 mRNA determined by RT-qPCR in bone marrow-flushed tibial diaphysis of vehicle and Cx43(M1)-treated mice. n = 4/group. (e, f) Representative images and quantitative analysis of the SOST-positive osteocytes (yellow arrows) in tibial midshaft cortical bone after 2 weeks of mechanical loading in vehicle and Cx43(M1)-treated mice. Scale bar: 30 μm (n = 8/group). (g) Sost mRNA determined by RT-qPCR from bone marrow-flushed tibial diaphysis of vehicle and Cx43(M1)-treated mice. n = 4/group. (h, i) Representative images and quantitative analysis of the β-catenin-positive periosteal cells (black arrows) on tibial midshaft endosteal surface after 2 weeks of loading in vehicle and Cx43(M1)-treated mice. Scale bar: 20 μm; n = 5–6/group. (j) Ctnnb1 mRNA determined by RT-qPCR in bone marrow-flushed tibial diaphysis of vehicle and Cx43(M1)-treated mice. n = 4/group. (k) Representative images of tibial midshaft endosteal surface stained for toluidine blue (top panel) or TRAP (low panel). The yellow arrows indicate osteoblasts and the black arrows indicate the TRAP-positive osteoclasts. Scale bar: 30 μm. (l) Histomorphometric quantitation of osteoblast per bone perimeter (n = 5–7/group). (m) Bglap2 mRNA determined by RT-qPCR in bone marrow-flushed tibial diaphysis of vehicle and Cx43(M1)-treated mice. n = 4/group. (n, o) Histomorphometric quantitation of osteoclast per bone perimeter (n) and osteoclast surface per bone perimeter (o) (n = 5–7/group). Data are expressed as mean ± SD. *, p < 0.05; **, p < 0.01; ***, p < 0.001. Statistical analysis was performed using paired t-test for loaded and contralateral within each treatment.


