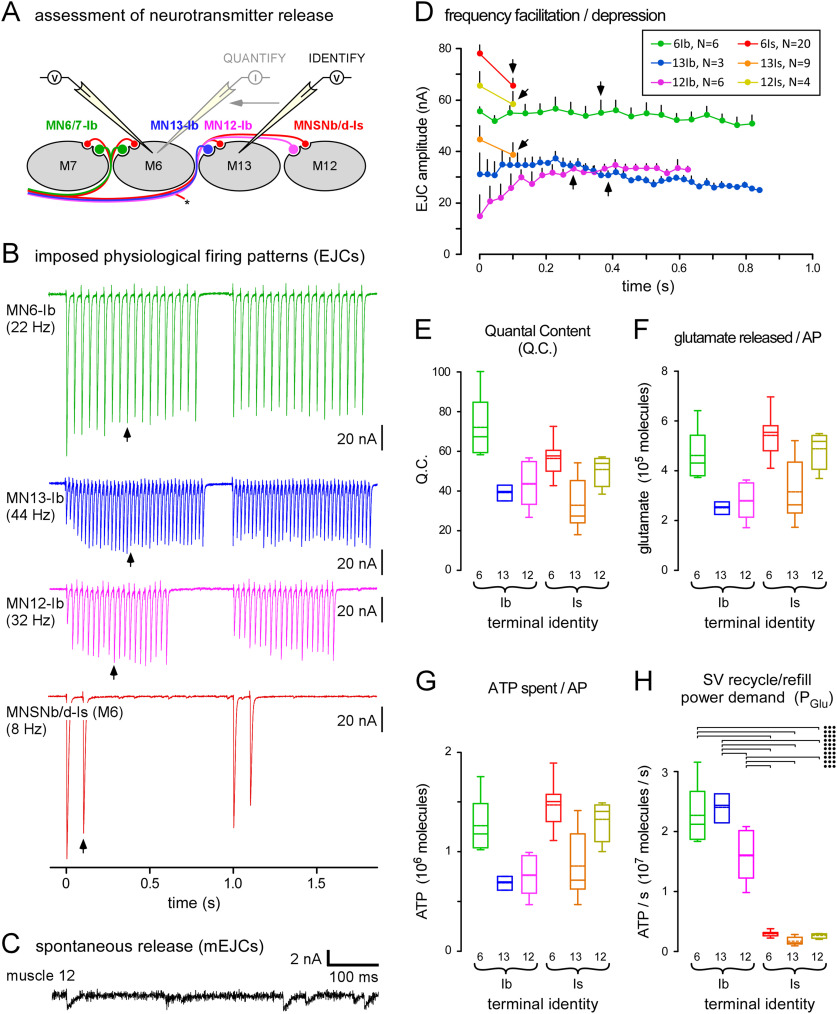
Figure 2.
Terminals are physiologically distinct, with different power demands for recycling and refilling synaptic vesicles (SVs). A, A diagram of a transverse section through muscle fibers #7, #6, #13, and #12 and their innervating motor neurons (MNs). Simultaneous current-clamp recordings in adjacent muscle fibers were used to identify which MN released neurotransmitter in response to an AP. A single muscle fiber was then voltage clamped with two electrodes to allow quantification of AP-evoked release. B, Sample electrophysiological traces showing EJCs, evoked from different MNs, as indicated. Release was evoked at the endogenous firing rate (EFR) (Hz) and for periods of time representing each MN's DC during peristaltic cycles of locomotion (1 per second). Recordings conducted in HL6 saline; 2 mm [Ca2+]o and 15 mm [Mg2+]o. C, Sample trace showing mEJCs recorded in muscle fiber #12. D, Plots of average EJC amplitude for each MN over the first peristaltic cycle (SEM shown). Arrows point to the mid-train EJC measured to quantify the physiological QC. Inset, Number of separate larvae (N) in which trains were evoked; applies to D–H. E, Plots of the average QC of each terminal, calculated by dividing the average physiological EJC amplitude by the average mEJC amplitude after mEJC amplitude is adjusted for terminal identity (see Materials and Methods for more details). F, Plots of the estimated number of glutamate molecules released after a single AP for each terminal (GluAP; Eq. 1). G, Plots of the estimated average amount of ATP spent to recycle and refill SVs after a single AP [E(GluAP); Eq. 2]. H, Quantification of the power demand for SV recycling and refilling for each terminal when active for a peristaltic cycle (1 s), as defined in D (PGlu; Eq. 3). Two-way ANOVAs applied in E–H. Data and statistics reported in Extended Data Table 2-1. The results of post hoc tests are only shown for power demand for SV recycling and refilling (H), where a two-way ANOVA was performed on ranks with Tukey's HSD tests. Terminal factor: p < 0.001, F(1,42) = 135.1; muscle factor: p = 0.038, F(2,42) = 3.5; interaction: p = 0.006, F(2,42) = 5.7. Only those post hoc tests revealing significant differences are delineated (•p < 0.05, ••p < 0.01, •••p < 0.001). Box plots (E–H) show mean (dotted line) and median, with 25–75% boxes and 5–95% whiskers.

