Figure 4.
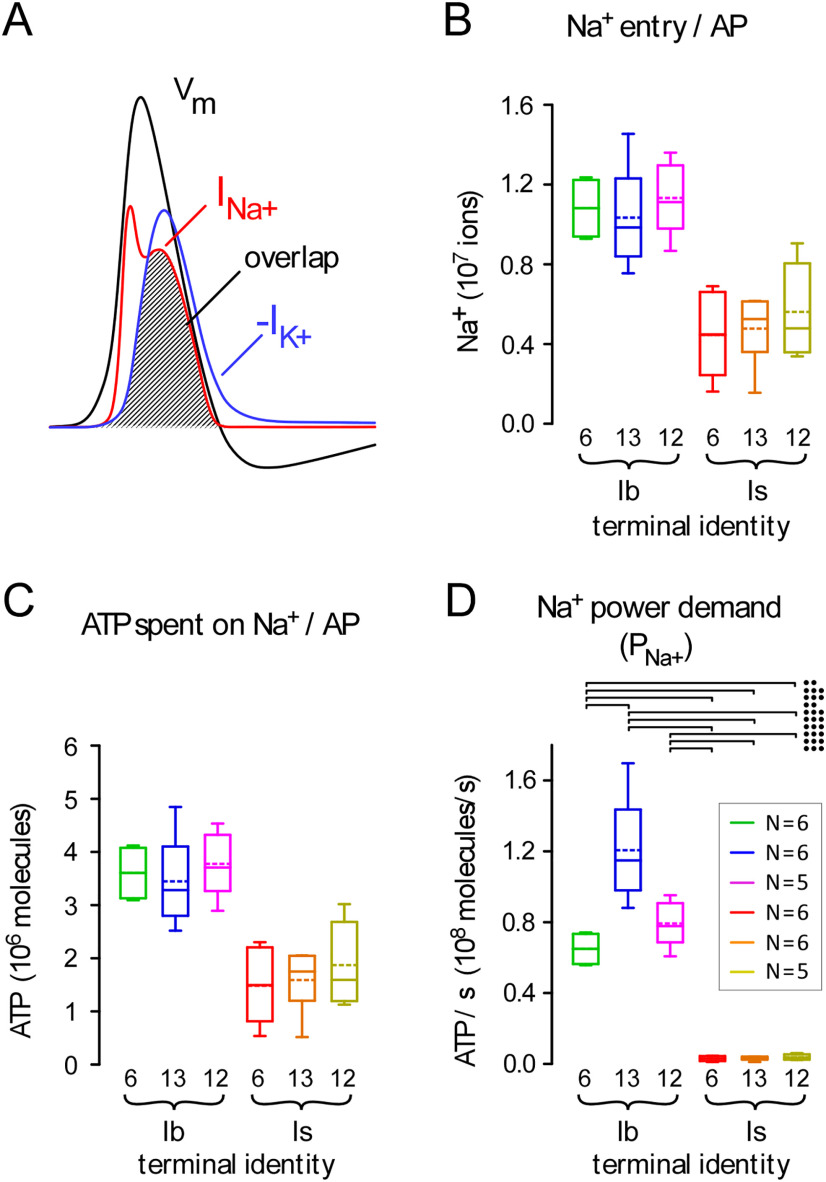
Terminals differ greatly in their power demands for Na+ extrusion. A, A representation of the presynaptic membrane potential during an action potential (AP) (black trace: Vm), and the underlying Na+ and K+ currents (INa+ and -IK+: red and blue traces, respectively). Plots modeled on the simulated Loligo giant axon AP of Hodgkin and Huxley (1952). The hatched window between INa+ and -IK+ represents the “overlap” between the respective ionic currents. B, Plots of theoretical estimates of total influx (number) of Na+ ions during a single AP for each terminal (Na+AP; Eq. 9). These estimates were extended to the terminals measured in Figure 1F. C, Plots of the average amount of ATP spent to extrude Na+ ions after a single AP [E(Na+AP); Eq. 10]. D, The power demand for Na+ extrusion for each terminal when active for a peristaltic cycle, as shown in Figure 2D (PNa+; Eq. 11). Inset, Number of terminals; applies to B–D. Two-way ANOVAs with Tukey's HSD tests applied in B–D. Data and statistics reported in Extended Data Table 4-1. The ANOVA was applied to ranks for Na+ extrusion power demand (D): terminal factor: p < 0.001, F(1,28) = 136.7; muscle factor: p = 0.012, F(2,28) = 5.1; interaction: p = 0.031, F(2,28) = 4.0. The results of post hoc tests are only shown for D, and only those post hoc tests revealing significant differences are delineated (•p < 0.05, ••p < 0.01, •••p < 0.001). Box plots (B–D) show mean (dotted line) and median, with 25–75% boxes and 5–95% whiskers.

