
Figure 6.
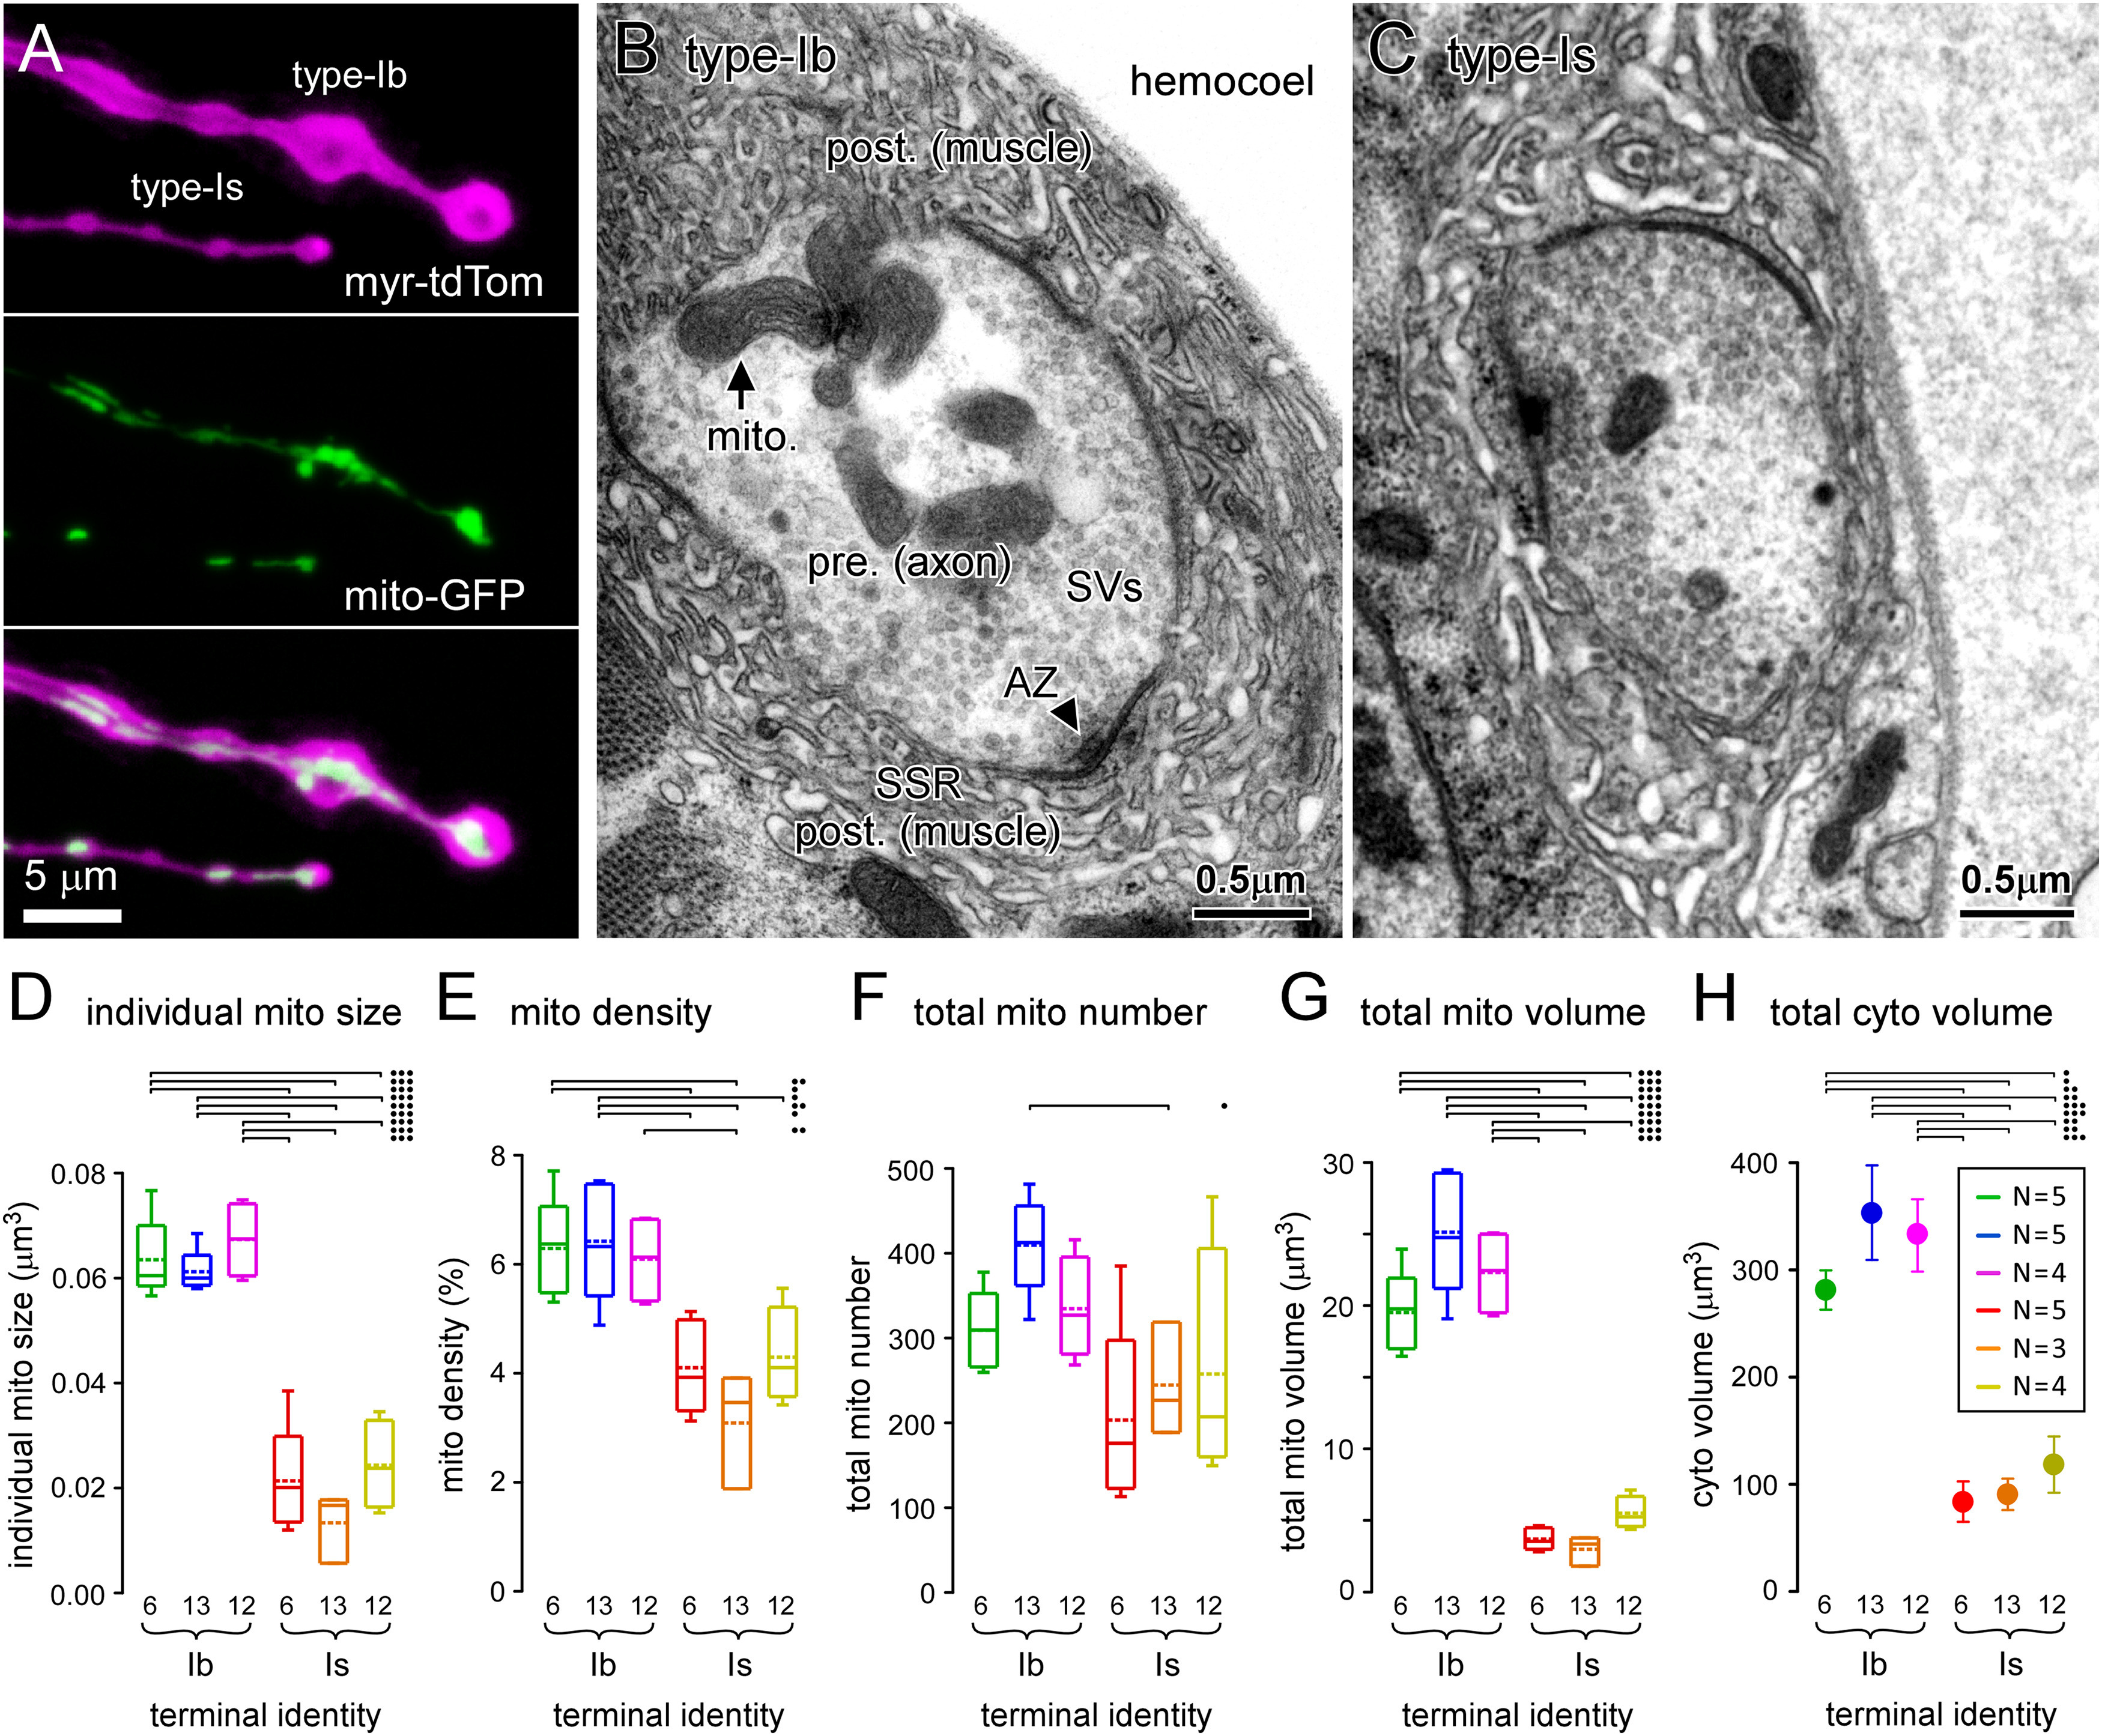
Terminals with the greatest power demands have the greatest mitochondrial size, density, number, and volume. A, Images of fluorescent proteins expressed in type-Ib and -Is terminal boutons on muscle fiber #13 (MN13-Ib and MNSNb/d-Is, respectively), using the nSyb MN driver, targeted to the PM (myristoylated tdTomato) and mitochondrial matrix (mt8-GFP). B, C, Transmission electron micrographs of 100-nm-thick sections through type-Ib and -Is terminal boutons on muscle fiber #6 (MN6/7-Ib and MNSNb/d-Is, respectively). D, Plot of the average individual mitochondrion size within each terminal. E, Plot of the average density of mitochondria in each terminal. F, Plot of the average number of mitochondria in each terminal, quantified using Equation 13. G, Plot of the average total mitochondrial volume occupying each terminal quantified using Equation 12. H, Plot of the average total cytosolic volume of each terminal quantified using Equation 16. Box plots (D–G) show mean (dotted line) and median, with 25–75% boxes and 5–95% whiskers. Error bars (SEM) were calculated according to propagation of uncertainty theory in G. The number (N) of reconstructed terminals (for D–H) is shown in inset in H. Two-way ANOVAs with Tukey's HSD tests applied in D–H. ANOVAs were performed on ranks in D, F. Individual mitochondrial size (D): terminal factor: p < 0.001, F(1,20) = 92.4; muscle factor: p = 0.093, F(2,20) = 2.7; interaction: p = 0.915, F(2,20) = 0.09. Mitochondrial density (E): terminal factor: p < 0.001, F(1,20) = 41.6; muscle factor: p = 0.573, F(2,20) = 0.57; interaction: p = 0.275, F(2,20) = 1.4. Total number of mitochondria (F): terminal: p = 0.002, F(1,20) = 12.5; muscle: p = 0.245, F(2,20) = 1.5; interaction: p = 0.580, F(2,20) = 0.56. Total mitochondrial volume (G): terminal factor: p < 0.001, F(1,20) = 292.6; muscle factor: p = 0.117, F(2,20) = 2.4; interaction: p = 0.059, F(2,20) = 3.3. Total cytosolic volume (H): terminal factor: p < 0.001, F(1,20) = 60.8; muscle factor: p = 0.383, F(2,20) = 1.0; interaction: p = 0.637, F(2,20) = 0.46. Only those post hoc tests revealing significant differences are delineated (•p < 0.05, ••p < 0.01, •••p < 0.001). Data and statistics reported in Extended Data Table 6-1.