
Figure 1.
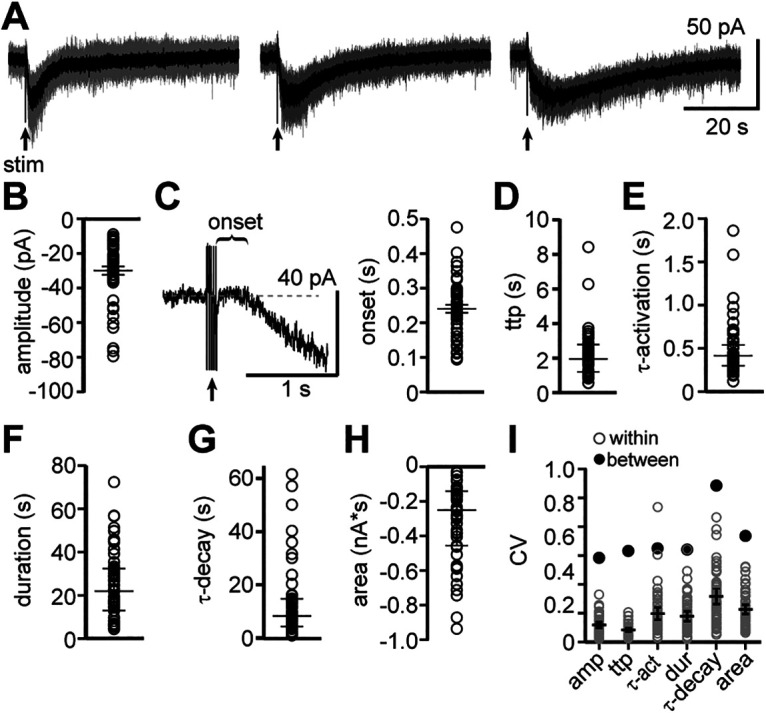
Basic properties of the α1-AR-dependent EPSC are variable across neurons but highly consistent within a single neuron. A, Example traces of electrically evoked (arrow) α1-AR-EPSCs from three neurons (gray: five successive sweeps; black: averaged trace). B, Plot of the maximal amplitude of α1-AR-EPSCs. C, Left, Example trace of the delay between the end of the stimulus and the initiation of the α1-AR-EPSC (onset). Right, Plot of the onset of the α1-AR-EPSCs. D, Plot of the time-to-peak (ttp) of α1-AR-EPSCs. E, Plot of activation kinetics (τ-activation) of α1-AR-EPSCs. F, Plot of the duration of α1-AR-EPSCs. G, Plot of decay kinetics (τ-decay) of α1-AR-EPSCs. H, Plot of charge transfer (area, nA*s) of α1-AR-EPSCs. I, Plot of coefficient of variation (CV) for each parameter in B–G (gray: CV for each sweep within a single neuron; black: CV for grouped data) demonstrating marked variability between neurons, but low variability within an individual neuron. Line and error bars in B, D–I represent median and quartiles, line and error bars in C represent mean ± SEM; n = 51.