Figure 7.

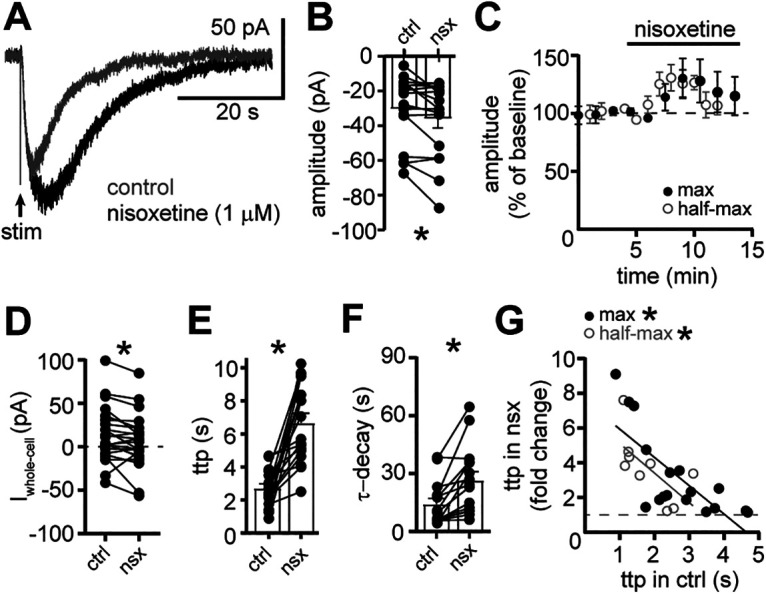
Clearance of noradrenaline by transporter-dependent reuptake limits the duration of the α1-AR-EPSC. A, Example traces of the α1-AR-EPSC in control conditions (gray) and nisoxetine (1 μm, black). B, Plot of the amplitude of the α1-AR-EPSC in control conditions (ctrl) and nisoxetine (nsx; p = 0.04, n = 17). C, Plot of the normalized amplitude of the maximal and half-maximal α1-AR-EPSCs versus time demonstrating the transient increase by nisoxetine. D, Plot of the whole-cell current in control conditions (ctrl) and nisoxetine (nsx; p = 0.01, n = 23). E, Plot of the time-to-peak (ttp) of the α1-AR-EPSC in control conditions (ctrl) and nisoxetine (nsx; p < 0.0001, n = 17). F, Plot of the τ-decay of the α1-AR-EPSC in control conditions (ctrl) and nisoxetine (nsx; p = 0.0002, n = 15). G, There were significant correlations between time-to-peak of the α1-AR-EPSC in control conditions (ctrl) and the increase in the time-to-peak of the maximal (black) and half-maximal (gray) α1-AR-EPSC in nisoxetine (nsx), shown as a fold-change (maximal: r = −0.70, p = 0.002, n = 17 pairs; half-maximal: r = −0.73, p = 0.03, n = 9, Spearman correlations). Solid lines represent best-fit lines by linear regression. Dashed line demarks no change in time-to-peak. Line and error bars represent mean ± SEM; * denotes statistical significance.
