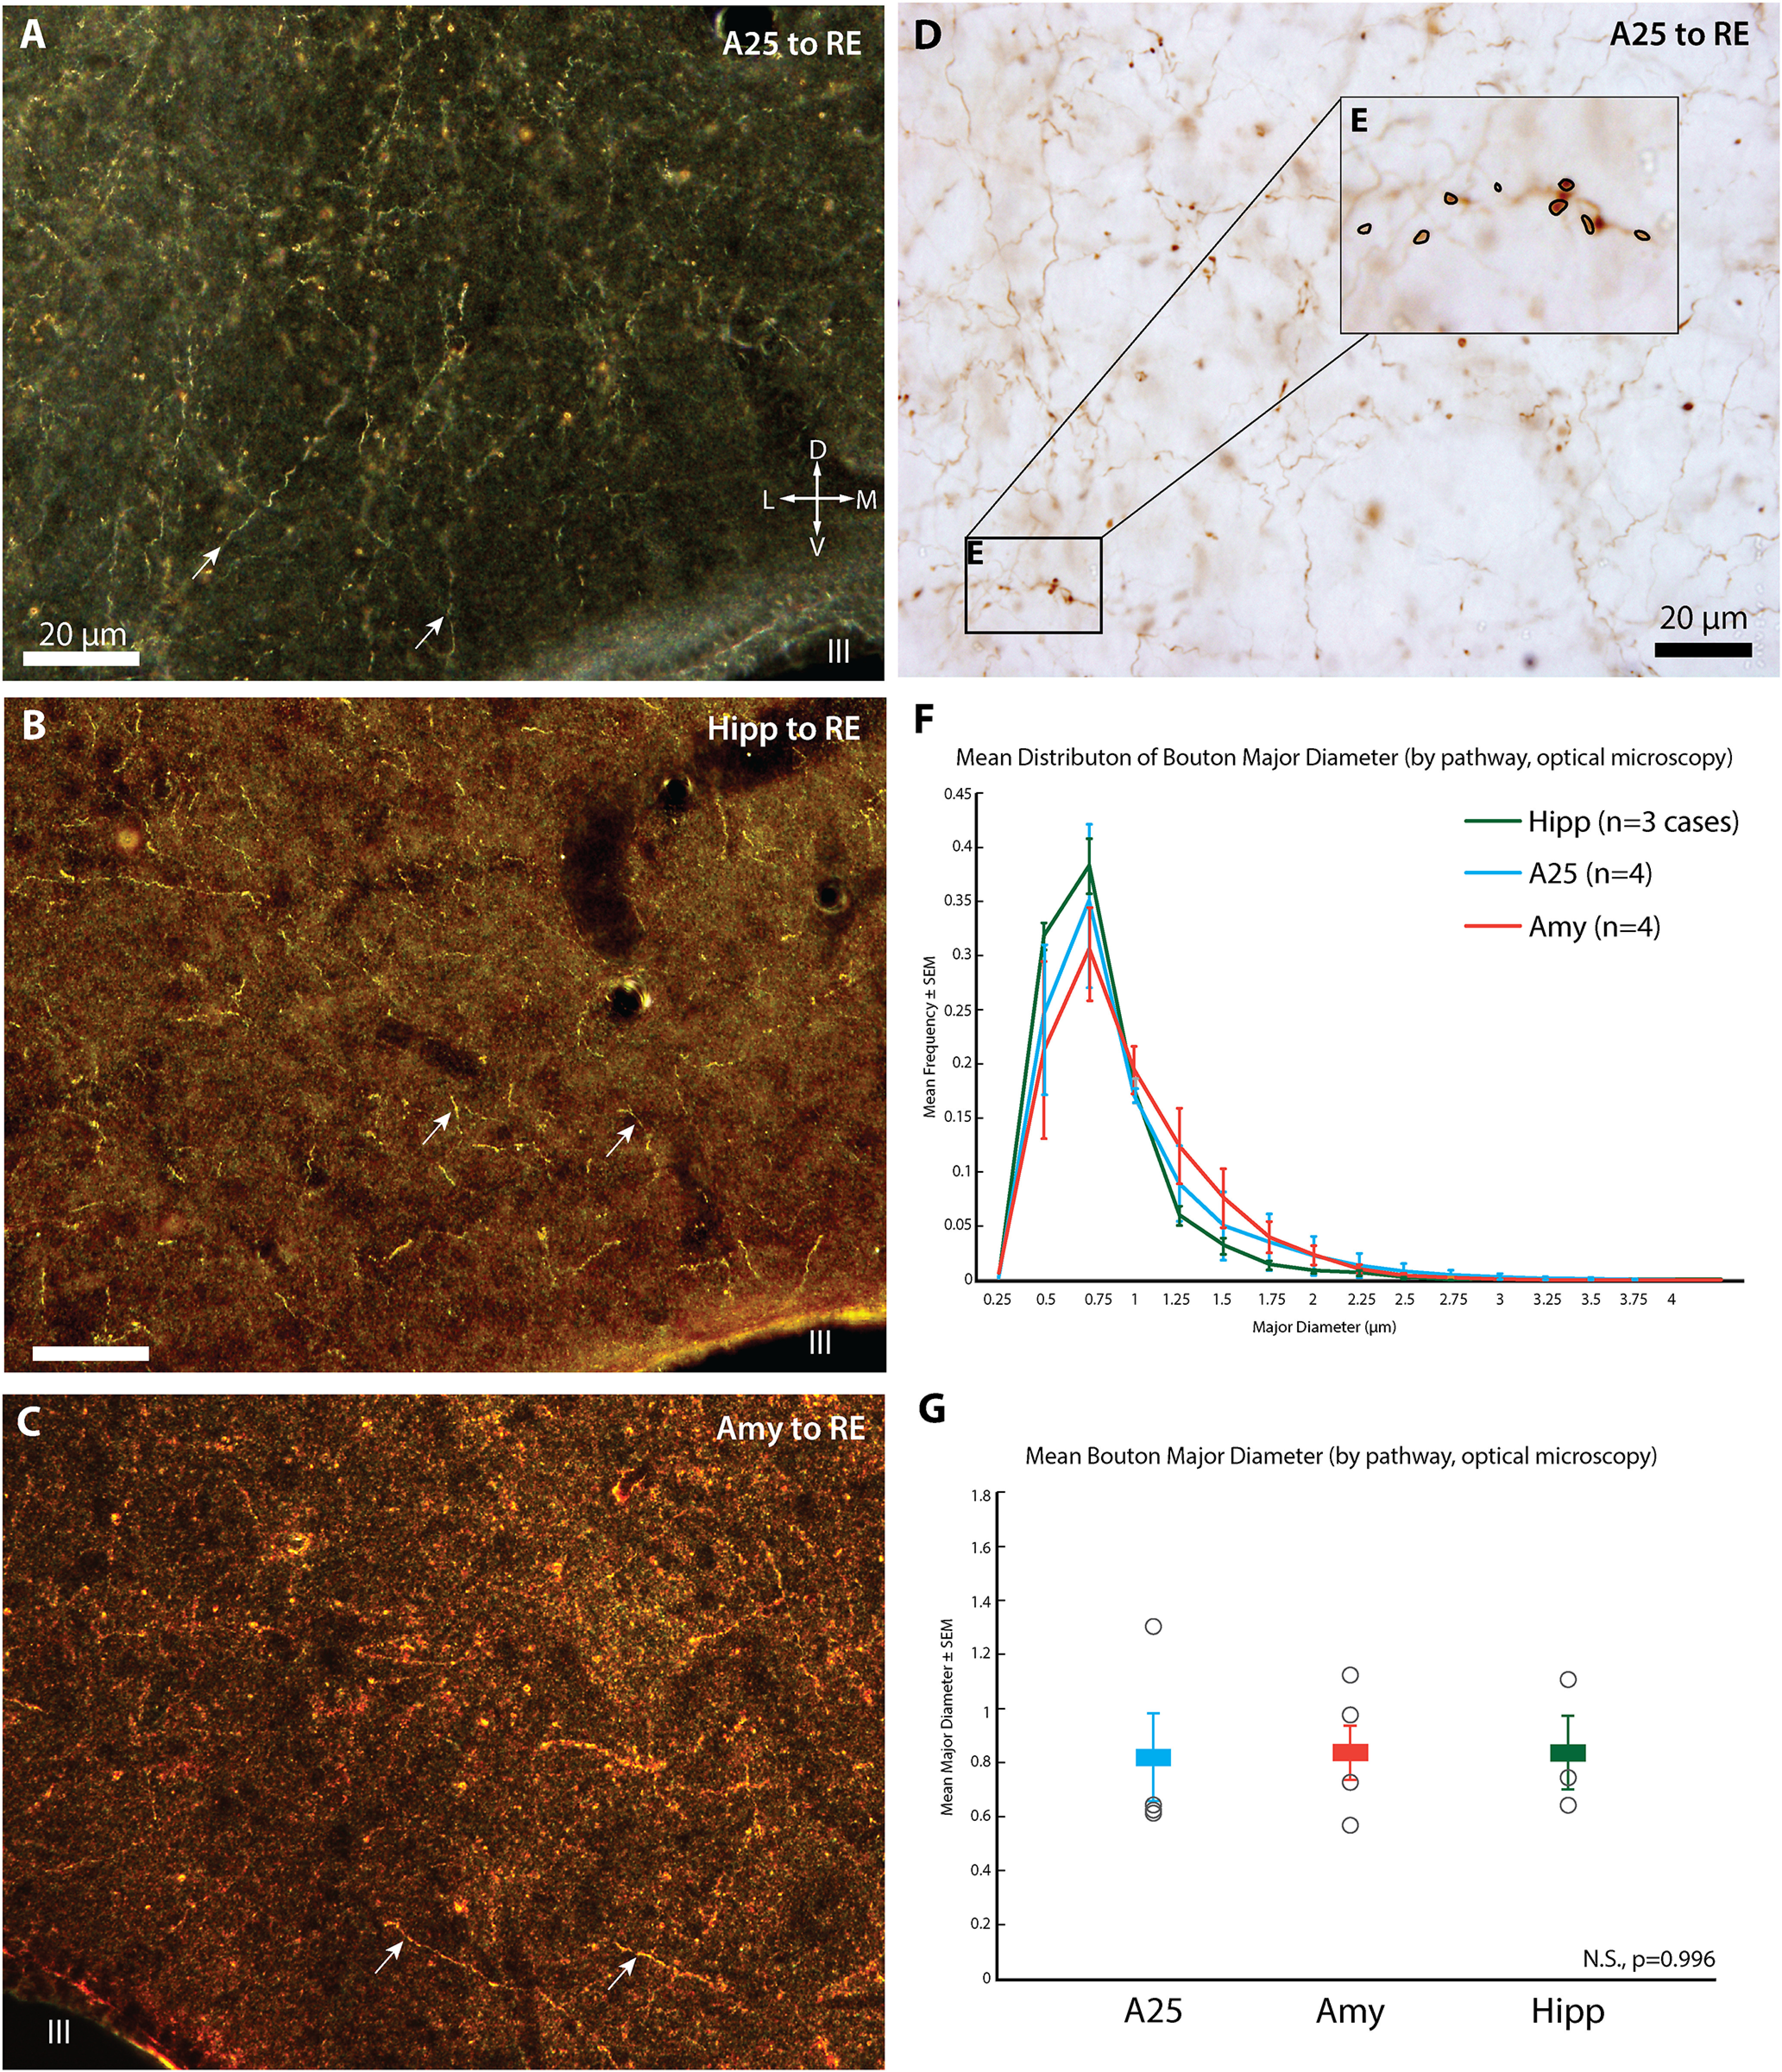
Figure 8.

Bouton Diameters. A, Darkfield photomicrograph of RE depicts axonal terminations (white arrows) from A25 (case BR, BDA tracer). Compass applies also to B, C. B, Darkfield photomicrograph of RE depicts axonal terminations (white arrows) from hippocampus (case BQ using Alexa488). C, Darkfield photomicrograph of RE (white arrowhead, case BM, FR tracer) depicts axonal terminations (white arrows) from amygdala. D, Brightfield photomicrograph of axonal terminations from A25 in RE (case BR, BDA tracer). E, Inset, From D. Axonal terminations in focus are circled to obtain their major diameter. F, Histogram depicting distribution of mean bouton diameter per pathway. G, Mean bouton diameter per pathway, color coded according to legend in F. Open black circles indicate individual cases used for each pathway (A25, top to bottom: BR–BDA, n= 4870 boutons; BS–LY, n = 2271; BU–FE, n = 1969; BQ–FR, n = 1658; Amy, top to bottom: BD–BDA, n = 2029 boutons; BB–BDA, n = 1046; BM–FR, n = 2968; BT–CBL, n = 1341; Hipp, top to bottom: BS–CBL, n = 436; BT–FE, n = 1066; BQ–A488, n = 2507). Amy, Amygdala; BDA, biotinylated dextran amine; CBL, Cascade Blue; D, dorsal; FE, Fluoroemerald; FR, Fluororuby; Hipp, hippocampus; III, third ventricle; L, lateral; LY, Lucifer yellow; M, medial; N.S., not significant; V, ventral.
