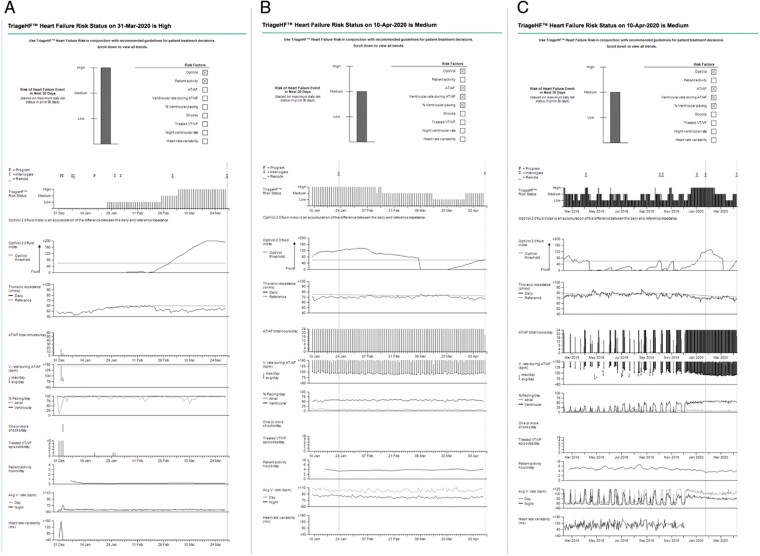
Figure 5.
Clinical management report derived from the CIED. Individual physiological data (comprised of OptiVol™ 2.0 fluid-index, thoracic impedance, activity, daily AF burden, etc.) are updated daily and combined to compute the Triage-HFRS. Individual parameters significantly contributing to the current Triage-HFRS are indicated by the checked boxes (top). (A) Corresponding with a fall in thoracic impedance and a rise in the OptiVol™ 2.0 fluid-index, this 90-day zoom depicts the HFRS transitioning from Low-, to Medium-, and then ultimately High-risk status. Each vertical line in the HFRS (90-day zoom) depicts 1 day. Of note, the Medium-risk status appear to be a transitionary risk state from which the patient moves up to High, or down to a Low risk status. (B) A 90-day zoom report showing a High HFRS in January/February, with subsequent transition to a Medium-risk status. (C) 14-month trended data for the same patient presented in B.

