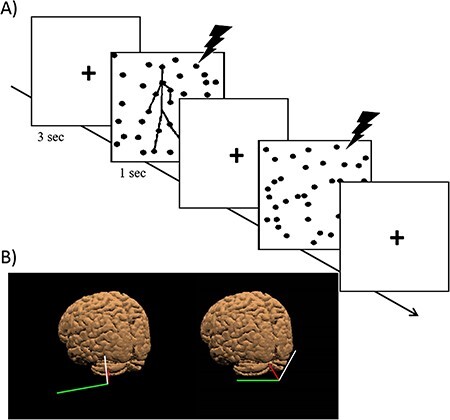
Figure 1 .

(A) The timeline of an experimental trial in Experiment 1. Each trial started with a fixation cross (3 s) followed by the animation (1 s) depicting either biological or scrambled motion. (B) Targeted sites on the scalp of one representative participant as shown by the neuronavigation system (SofTaxic 2.0, EMS, Bologna, Italy): (left side) posterior left cerebellar hemisphere (lobule VI/Crus I, x = −38, y = −66, z = −16, TAL); (right side) the vermis (Lobule VI, x = 0, y = −71, z = −14, TAL). The red line represents the magnetic field generated by the stimulator, and the white and green segments represent the longitudinal and lateral orientation of the coil, respectively.
