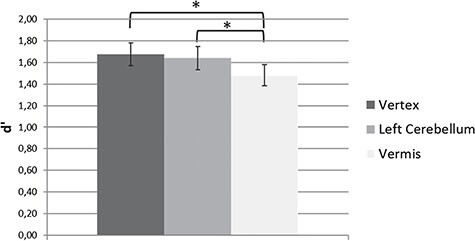
Figure 2 .

Mean d′ rates as a function of TMS site (vertex, left cerebellum and vermis) in Experiment 1. Triple-pulse 20 Hz TMS given at stimuli onset over the vermis affected participants’ ability to detect biological motion compared to stimulation of the left cerebellum and of the vertex (control condition). Error bars represent ±1 SEM. Asterisks denote a significant difference between TMS conditions.
