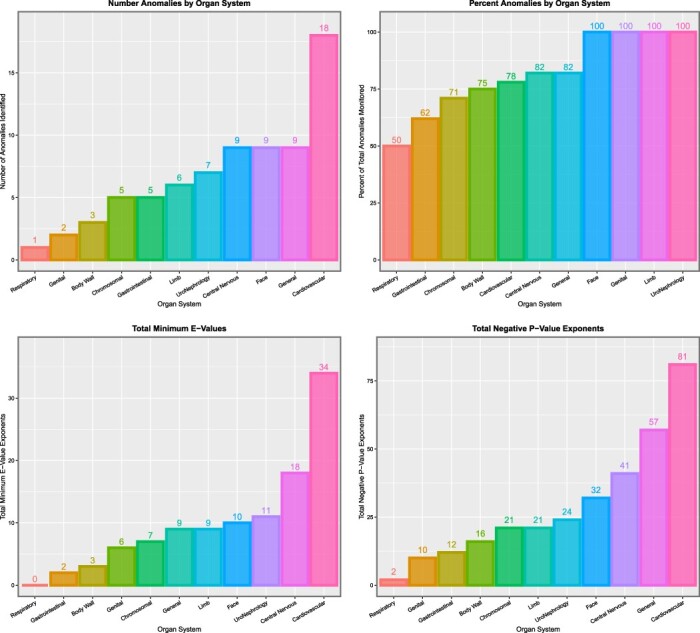
Figure 12:

Summaries of E- and P-values by organ system. (A) Number of anomalies with elevated mEV. (B) Percentage of anomalies with elevated mEV. (C) The sum of the mEV exponents. (D) The sum of the negative exponents of the significant P-values for the additive IPW multivariable panel model
