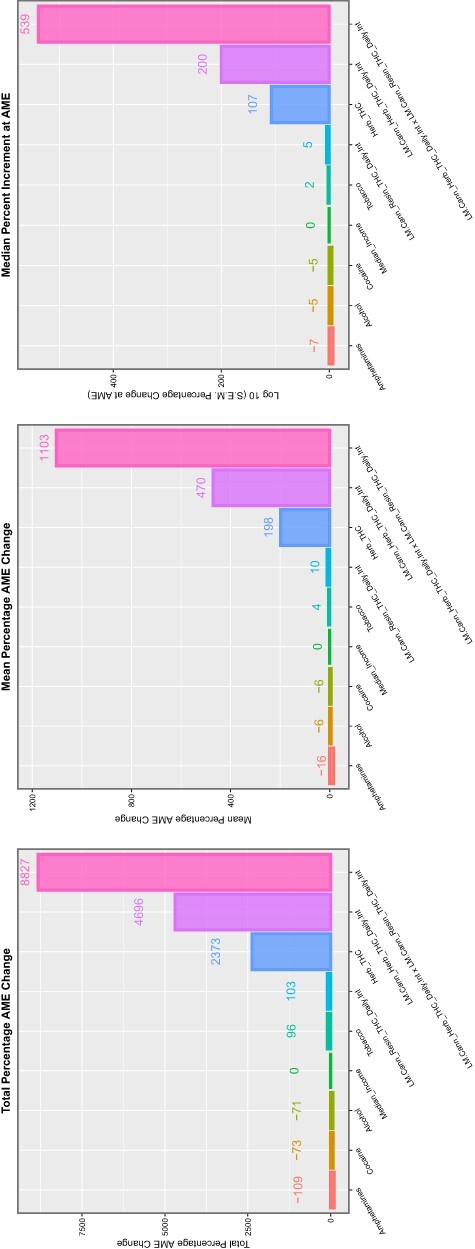
Figure 17:

Summaries of marginal (overall) effects by substance type for (A) total percentage change at average marginal effect (AME), (B) the mean percentage change at AME and (C) the median percentage change at AME for the interactive multivariable IPW panel model temporally lagged by six years
