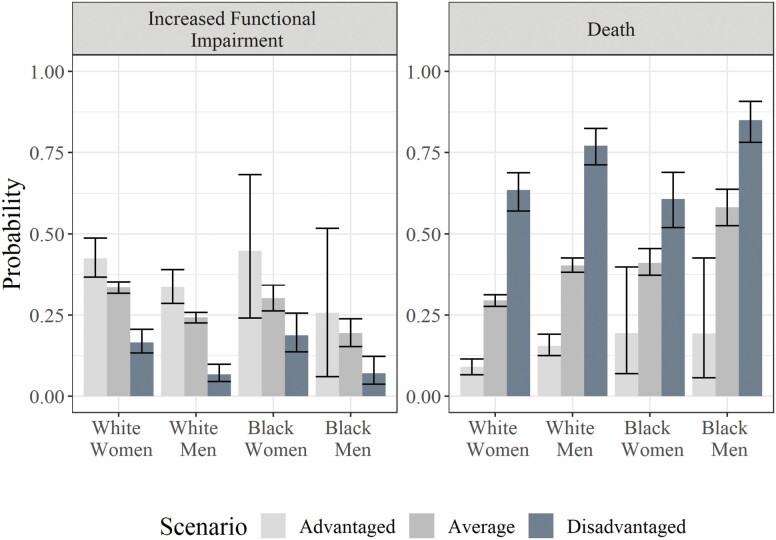
Figure 1.
Predicted probability of having an increase in limitations or dying as calculated from multinomial logistic regression models stratified by race and gender. The predicted probability is on the y axis and the race gender group is on the x axis. Probabilities from the advantaged scenario are shaded in light gray; probabilities from the averaged scenario are shaded in gray; the probabilities from the disadvantaged scenario are shaded in dark gray. The error bars reflect 95% confidence intervals calculated via bootstrapping.

