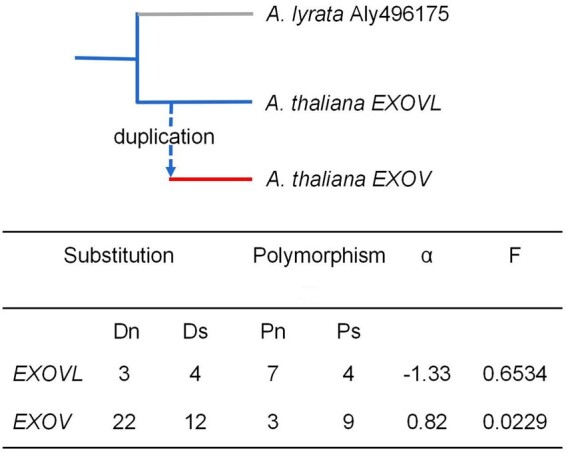
Figure 3.

McDonald–Kreitman test of natural selection. The subscripts n and s indicate nonsynonymous and synonymous changes, respectively. α for EXOV is the proportion of substitution driven by positive selection; α for EXOVL may be the sampling error or segregation of deleterious mutations (Smith and Eyre-Walker, 2002). F, Fisher’s exact probability.
