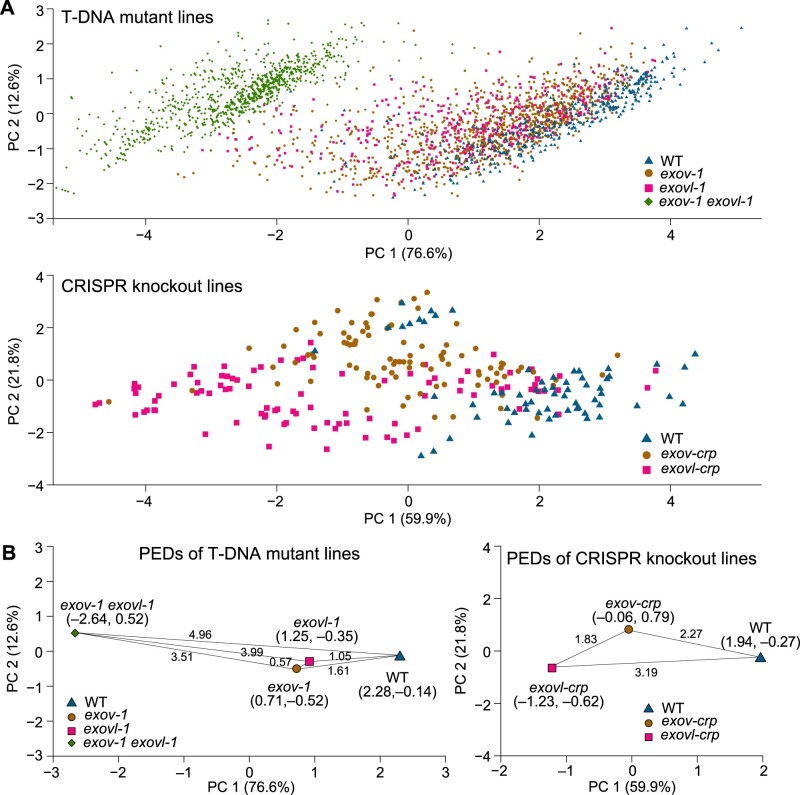
Figure 7.
PCA of the phenotypic effect of the new and parental genes and their PED distances. A, Distribution of principle components of mutant lines. Number of individuals for each genotype: exov-1, 1,098; exovl-1, 389; double mutant, exov-1 exovl-1, 1,028; WT (Col-0), 413; exov-crp, 96; exovl-crp, 96; WT, 64. B, Distances of phenotypic evolution among mutants. The PED distance among mutants, defined as a geometric distance using the average values of PC1 and PC2 for each population (the pairs of coordinates in PC1 and PC2 respectively are given under each mutants and WT).

