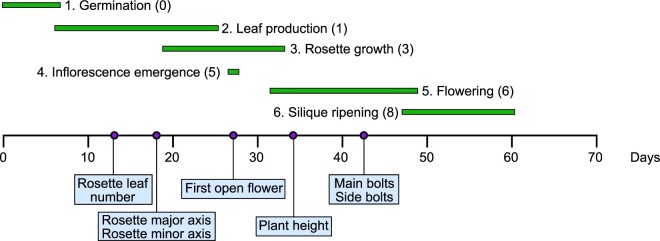
Figure 8.
Distribution of observed traits in the growth of A. thaliana as adapted from Boyes et al. (2001). The purple dots along the x-axis represent the timing of phenotypic measurements. The number in parentheses indicates the growth stage, as defined by Boyes et al. (2001).

