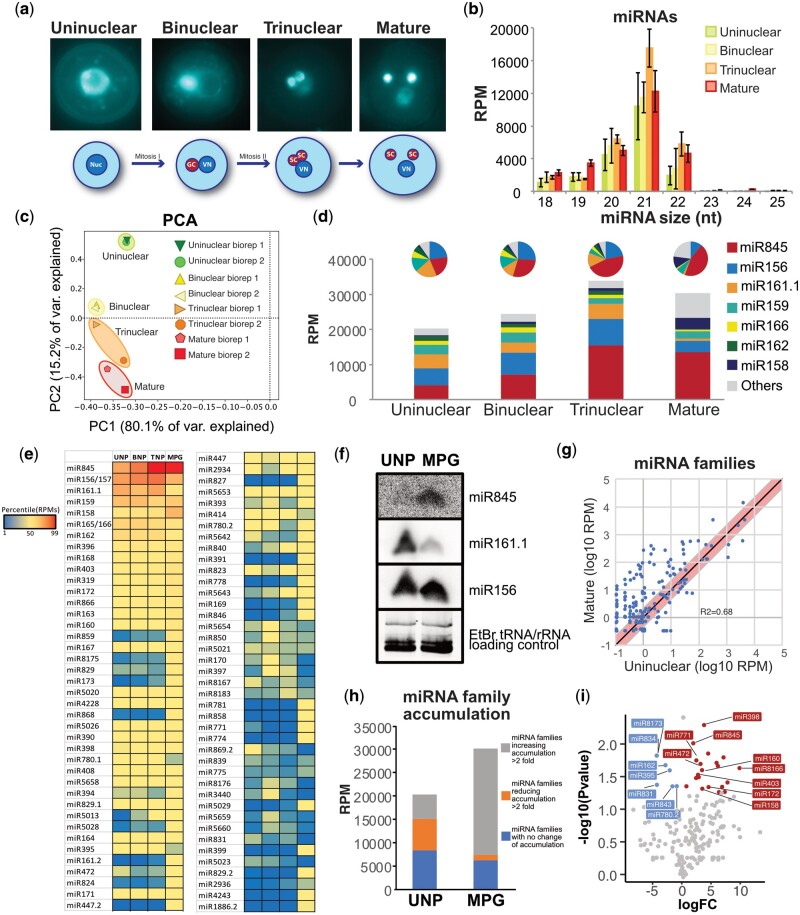
Figure 1.
miRNome dynamics during pollen development. A, Representative images of the pollen developmental stages analyzed here. B, microRNA size distribution and accumulation for the developmental stages shown in (A). C, Principal component analysis of the small RNA libraries from different pollen developmental stages based on miRNA levels. D, Bar charts depicting the accumulation of main miRNAs during pollen development for each developmental stage expressed in reads per million. On top of each the same data are shown as a pie chart. E, Heat map of miRNA families accumulation level during pollen development. F, Northern blot showing the increase in accumulation of miR845, the stable accumulation of miR156 and the decrease of miR161.1. The U6 small nuclear RNA was used as a control for RNA loading. 20 μg of total RNA from the uninuclear and mature pollen stages were used to obtain a better resolution of the accumulation dynamic. UNP, uninuclear pollen; MP, mature pollen grain. G, Scatter plot of miRNA family expression values in the uninuclear and mature pollen grain developmental stages. The red line marks a two-fold change in accumulation. H, Categorization of miRNA families according to their increase (more than two-fold, grey), decrease (more than two-fold, orange), or no change (blue) in accumulation in the mature pollen grain compared to the uninuclear pollen. I, Volcano plot of miRNA expression changes between uninuclear and mature pollen grain developmental stages. Significant values (assessed with a paired t test, P < 0.05) are marked in blue or red for downregulated or overexpressed miRNAs in the mature pollen stage.

