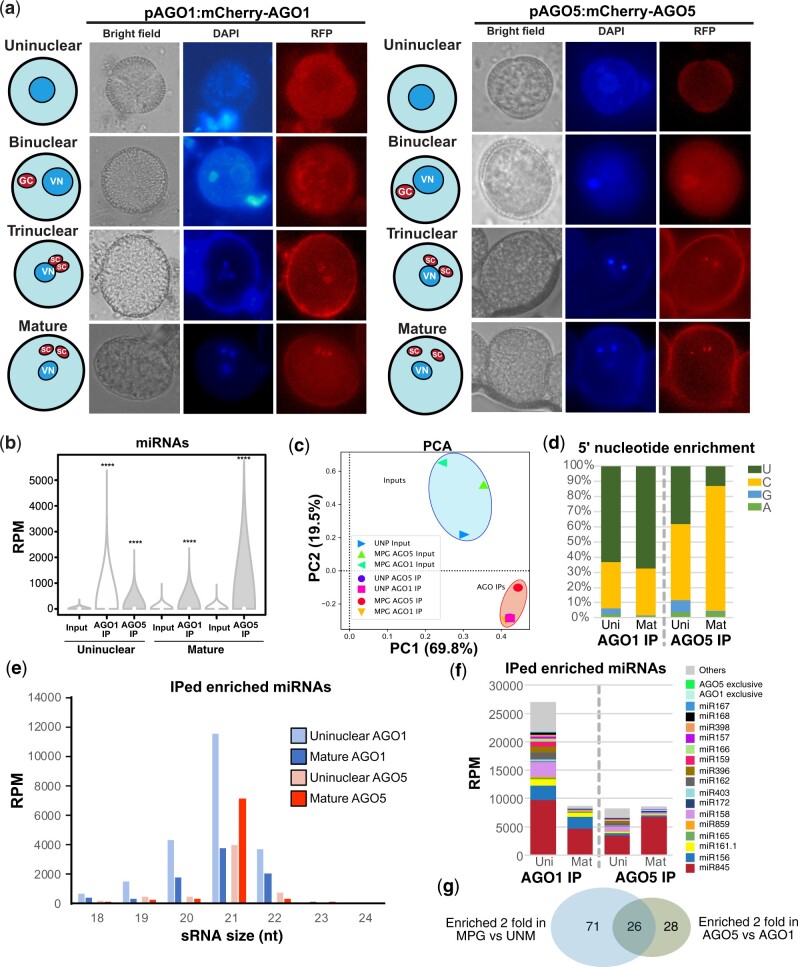
Figure 2.
Comparison of AGO1 and AGO5 activity and loaded miRNAs during pollen development. A, Analysis of the cellular localization of AGO1 and AGO5–mCherry–AGO fusion proteins during pollen development. Drawings accompanying the images represent the localization of the different nuclei on each picture. B, Analysis of miRNA enrichment for AGO1 and AGO5 immunoprecipitated sRNAs compared to their respective input controls. Significance was assessed by means of a Mann–Whitney U test (**** denotes a significance of P < 0.00001). C, Principal component analysis of the small RNA libraries from different AGO immunoprecipitations and their input controls based on miRNA levels. Venn diagram shows the overlap between the miRNA families loaded in AGO1 and AGO5. D, 5′-nt enrichment for AGO-enriched miRNAs. E, Size distribution of miRNAs enriched in the AGO1 and AGO5 IPs. F, Accumulation of enriched miRNA families in AGO1 and AGO5. In (C)–(F) miRNAs were considered enriched if their accumulation was higher than two-fold their accumulation in the input library or if it was only detected in the AGO immunoprecipitated library. G, Venn diagram showing the overlap of miRNA families enriched more than two fold in the mature pollen grain (blue circle) and miRNA families enriched more than two-fold in AGO5 IP compared to AGO1 IP. Significance (P = 0.032807) was calculated using the Chi-square statistic with Yates correction.

