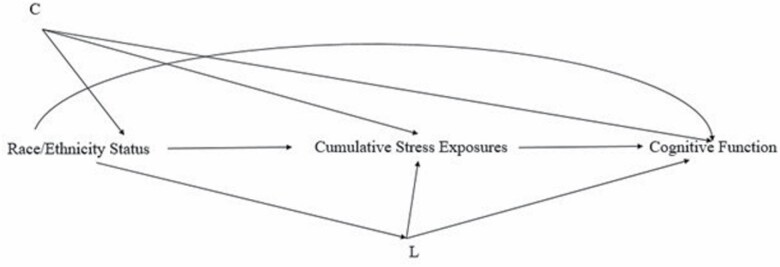
Figure 1.
Directed acyclic graph showing the hypothesized relationships between the exposure, mediator, outcome, and confounders. “C” denotes exposure–outcome confounders, including age, sex, and sample status; “L” denotes mediator–outcome confounders, including education, income, spousal status, parental status, working status, and chronic conditions.

