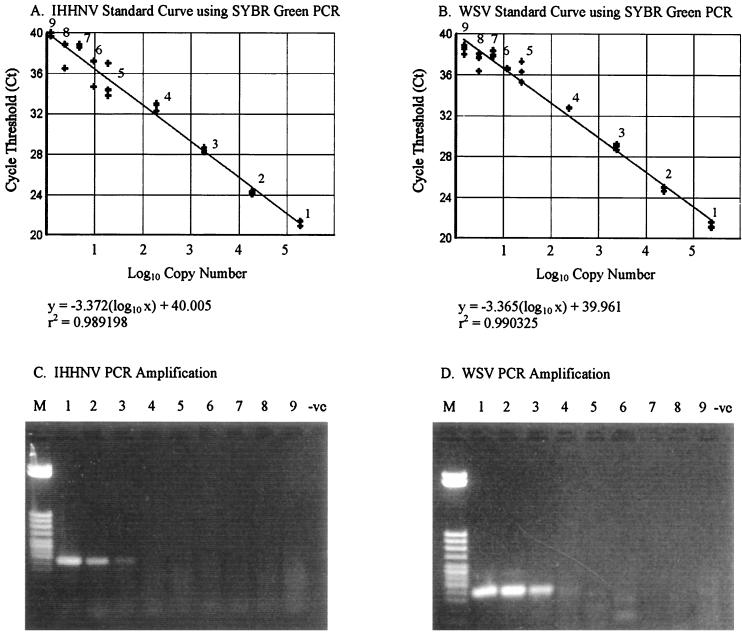
FIG. 1.
Linear relationship between CT values and the dilutions of the plasmid DNAs of IHHNV (A) and WSV (B) samples. The exact numbers of copies of the IHHNV plasmid added to each reaction mixture (corresponding to the numbers on the linear curve) were as follows: 1.88 × 10⁵ (1), 1.88 × 10⁴ (2), 1.88 × 10³ (3), 1.88 × 10² (4), 1.88 × 101 (5), 9.4 (6), 4.7 (7), 2.35 (8), and 1.18 (9). For WSV samples, the plasmid copy numbers were 2.37 × 10⁵ (1), 2.37 × 10⁴ (2), 2.37 × 10³ (3), 2.37 × 10² (4), 2.37 × 101 (5), 11.85 (6), 5.93 (7), 2.96 (8), and 1.48 (9). The amplifications of IHHNV and WSV DNAs from the same plasmid dilutions by conventional PCR are shown in panels C and D, respectively. The lane numbers refer to the plasmid copy numbers mentioned above. Lane M, 50-bp DNA step ladder (Sigma); lane −ve, negative control.

