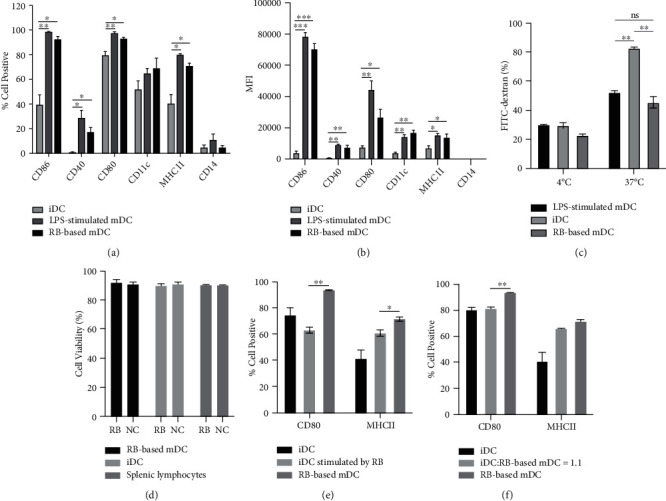
Figure 4.

RB-treated LLCs induced the mature DC phenotype. The percentage of positive cells was shown according to the FMO control. On day 6, iDCs were collected and cultured with RB-treated LLCs for 69 h. The results are shown as “RB-based mDC.” As a positive control, iDCs were stimulated with LPS for 24 h. The results are shown as “LPS-stimulated mDC.” And iDCs without stimulation were used as negative control. (a, b) The percentage and the mean fluorescence intensity (MFI) of cells that stained positive for the cell surface markers of the mature DC phenotype. The data are representative of 8 experiments. The assay was carried out in triplicate and repeated three times. (c) RB-based mDCs or LPS-stimulated mDCs significantly reduced FITC-dextran uptake compared with iDCs. (d) iDCs, RB-based mDCs, and splenic lymphocytes were treated with 1 mM RB for 24 h. Cells were cultured in medium without RB as a negative control (referred as “NC”), and then, the cells were quantified using Vi-cell XR. (e, f) iDCs stimulated by RB alone (e) or RB-based mDCs (f) did not undergo maturation. The data shown are mean ± SD from representative of three independent experiments. Significance between samples was calculated by Student's t-test (d) and one-way ANOVA (a–c, e, f) (ns indicates no statistical significance, ∗P < 0.05, ∗∗P < 0.01, ∗∗∗P < 0.001, ∗∗∗∗P < 0.0001).
