Figure 4.

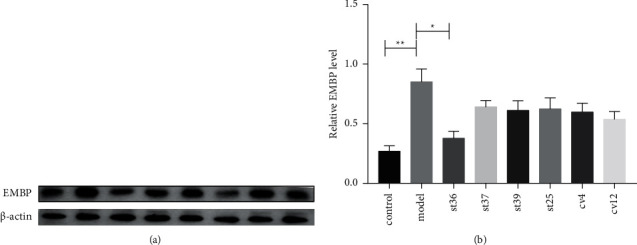
The effect of EA on the expression of EMBP on FD rats. (a) The expression of EMBP; (b) the expression of EMBP. The results of quantification are expressed as the mean ± SEM. ∗p < 0.05, ∗∗p < 0.01 compared with the FD model group, n = 6.

The effect of EA on the expression of EMBP on FD rats. (a) The expression of EMBP; (b) the expression of EMBP. The results of quantification are expressed as the mean ± SEM. ∗p < 0.05, ∗∗p < 0.01 compared with the FD model group, n = 6.