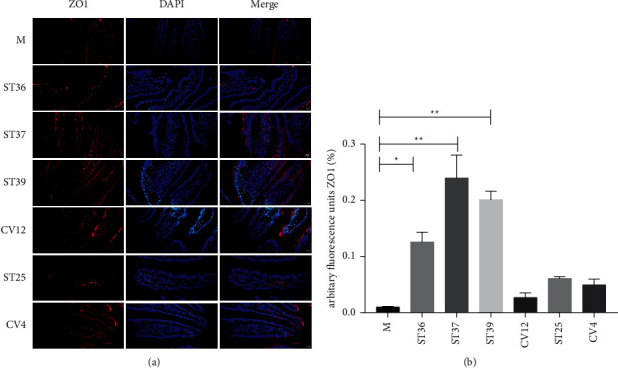
Figure 6.

The effect of EA on the expression of ZO1 on FD rats. (a) Typical results of immunofluorescence staining to detect the expression of ZO1 (red). Blue signals indicate DAPI nuclear staining (scale bar, 20 μm); (b) the percentage of ZO1 in duodenal mucosa (% of marked number). The results of quantification are expressed as the mean ± SEM of at 6 photos. ∗p < 0.05, ∗∗p < 0.01 compared with the FD model group, n = 6.
