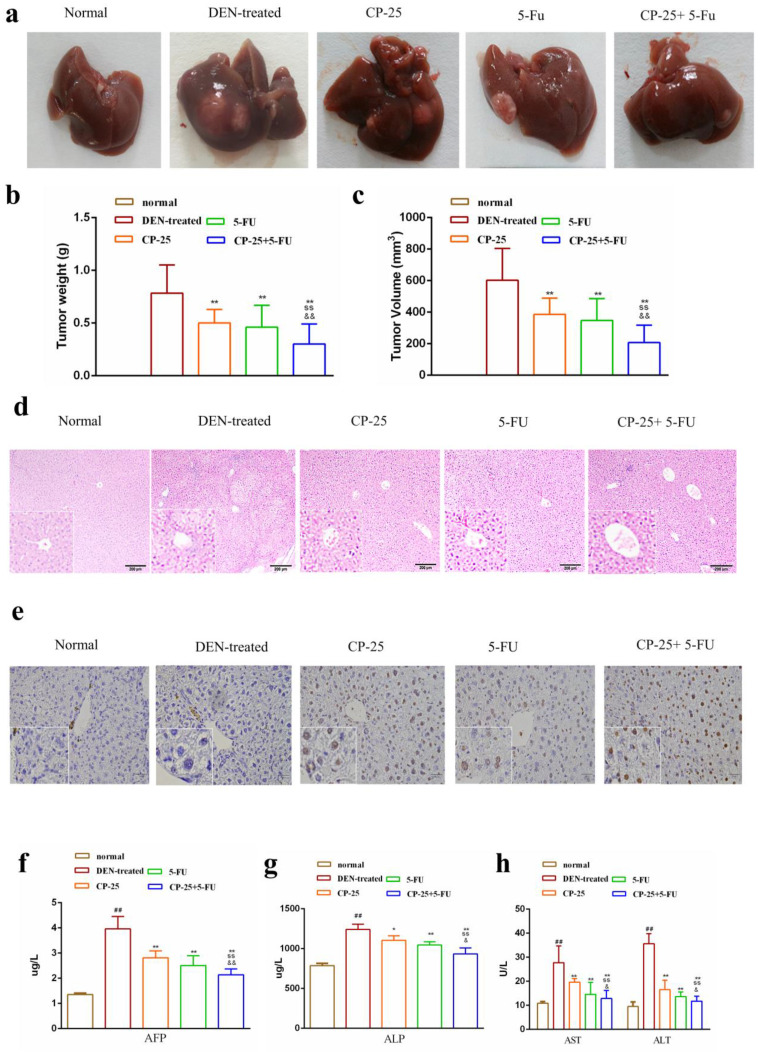
Fig 2.
Combination treatment with 5-Fu and CP-25 inhibited tumorigenicity in vivo. a: Representative images of the liver tumors in the different groups. b, c: The final tumor weight and volume in each group after treatment. d, e: Representative images of hematoxylin and eosin (H&E) and tunel staining in each group (original magnification×200). f-h: The levels of ALT, AST, ALP, AFP in each group. All data are expressed as means ± standard deviation. #P< 0.05,##P< 0.01, versus normal group; *P< 0.05, **P< 0.01, versus DEN-treated group, sP< 0.05, ssP< 0.01, versus CP-25 alone group; &P< 0.05, &&P< 0.01, versus normal group versus 5-Fu alone group.

