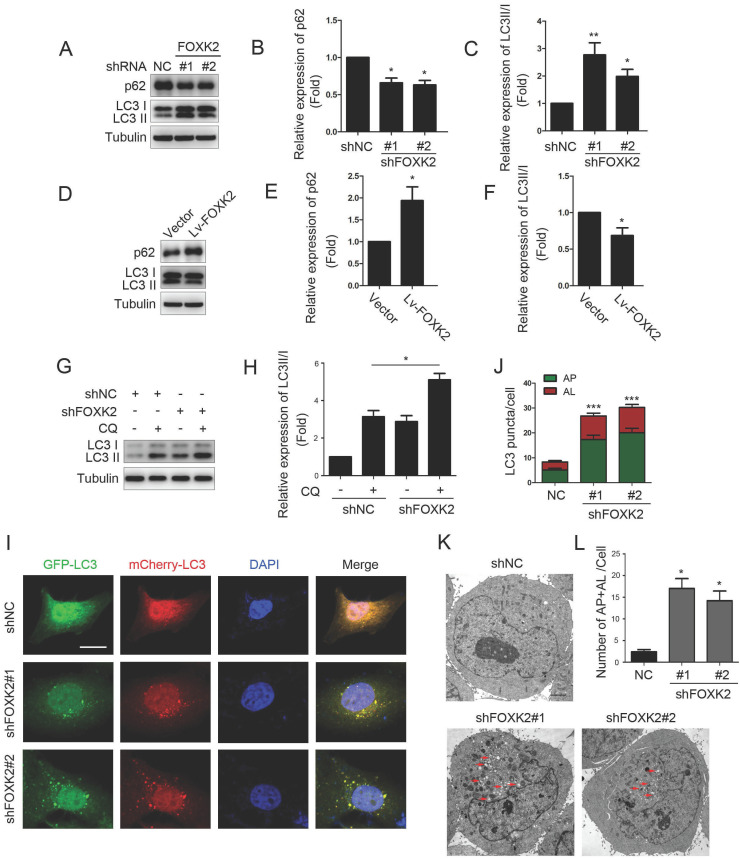
Figure 3.
Knockdown of FOXK2 promoted autophagy of PTC cells. (A) Western blot detection of p62 and LC3 in BHT-101 cells transfected with indicated plasmids. (B, C) The protein expression of p62 (B) and LC3II/I (C) in BHT-101 cells was visualized via quantitative analysis. * P < 0.05; **P < 0.01. (D) Western blot detection of p62 and LC3 in BCPAP cells transfected with indicated plasmids. (E, F) The protein expression of p62 (E) and LC3II/I (F) in BCPAP cells was visualized via quantitative analysis. * P < 0.05. (G) Western blot detection of LC3 in BHT-101 cells transfected with the indicated shRNA, pre-treated with 60nM CQ or vehicle (DMSO). (H) The protein expression of LC3II/I in BHT-101 cells was visualized via quantitative analysis. *P < 0.05. (I) Autophagic flux is shown by representative confocal microscopic images of BHT-101 cells stably-expressing GFP-mCherry-LC3 transfected with the indicated shRNA. Scale bar, 10 μm. (J) Quantitation of autophagosomal (yellow) and autolysosomal (red) LC3 puncta. Results are presented as mean ± s.e.m. from three independent experiments, ***P < 0.001. (K) Representative electron microscopic image of autophagic vesicles in BHT-101 cells transfected with the indicated shRNA. Scale bars, 500 nm. (L) Electron microscopic quantification of autophagic vesicles in BHT-101 cells transfected with the indicated shRNA. Data are presented as mean±s.e.m. from 3 independent experiments; *P < 0.05.

