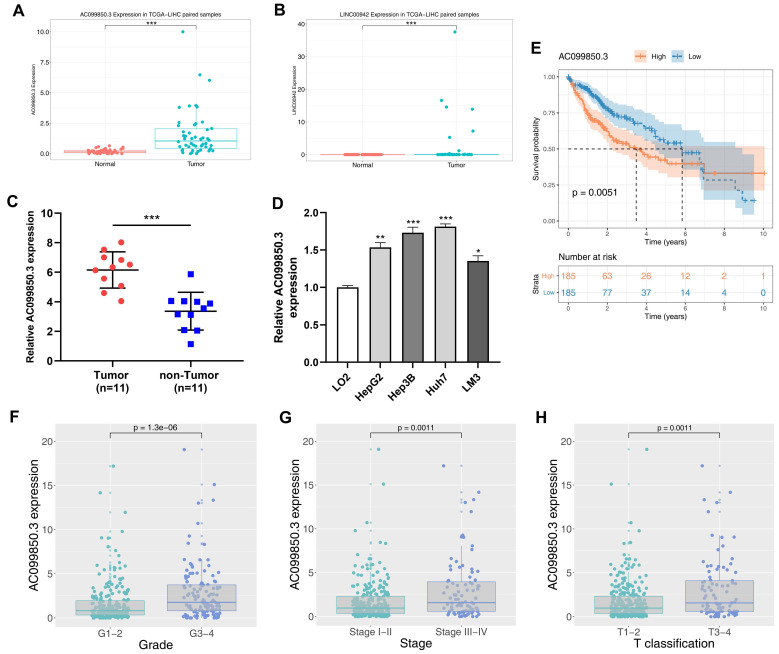
Figure 2.
Clinical correlation and prognosis analysis of AC099850.3. Notes: A: The expression of AC099850.3 in TCGA-LIHC; B: The expression of LINC00942 in TCGA-LIHC; C: The expression pattern of AC099850.3 in 11 paired HCC tissue relative to GAPDH; D: The expression of AC099850.3 in normal and HCC cell lines relative to GAPDH; E: Kaplan-Meier curve of OS in high and low AC099850.3 group; F-H: Clinical correlation of AC099850.3. Abbreviations: OS, Overall survival; TCGA, The Cancer Genome Atlas.

