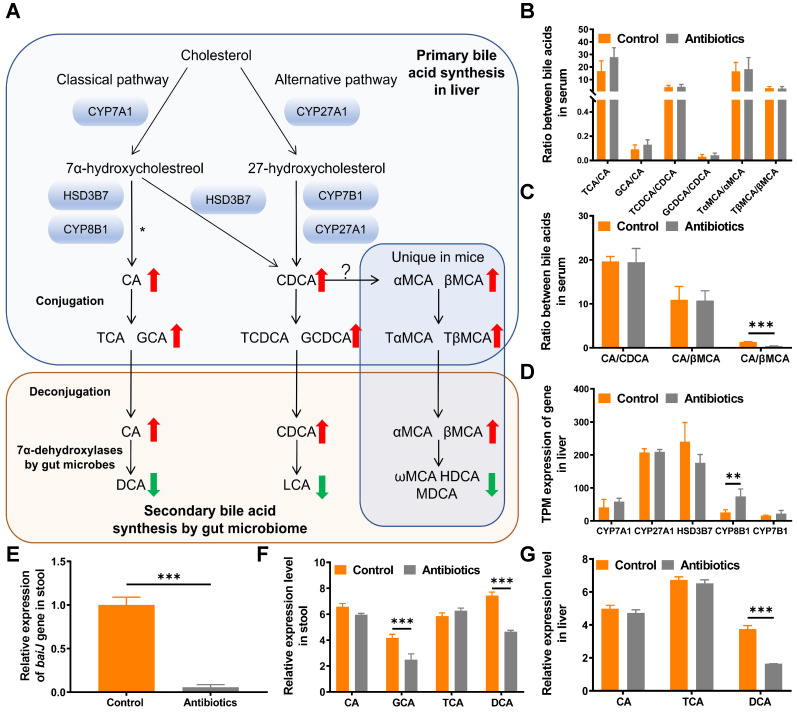
Figure 4.
Metabolomics analysis reveals that DCA is a key metabolite. (A) Bile acid metabolism pathway. The red upward arrow indicates increasing levels of metabolites in serum after two weeks of treatment with non-absorbable antibiotics. The green downward arrow indicates decreasing levels of metabolites in serum after two weeks of treatment with non-absorbable antibiotics. (B) Ratio of conjugated primary bile acids to primary bile acids. (C) Ratios of primary bile acids. (D) Expression of bile acid synthesis-related genes in transcripts per million (TPM). (E) Quantitative PCR analysis of the BaiJ gene of Clostridium XIVa showed that antibiotic treatment significantly reduced its expression. (F) Relative expression of bile acid metabolites in mouse fecal samples and (G) liver tissues. *P < 0.05, ** P < 0.01, *** P < 0.001; CA, cholic acid; CDCA, chenodeoxycholic acid; αMCA, alpha-muricholic acid; βMCA, beta-muricholic acid; TCA, taurocholic acid; GCA, glycine cholic acid; TCDCA, taurochenodeoxycholic acid; GCDCA, glycochenodeoxycholic acid; TαMCA, tauro-α-muricholic acid; TβMCA, tauro-β-muricholic acid; DCA, deoxycholic acid; LCA, lithocholic acid; ωMCA, omega-muricholic acid; HDCA, hyodeoxycholic acid; MDCA, murideoxycholic acid.

