
Figure 4.
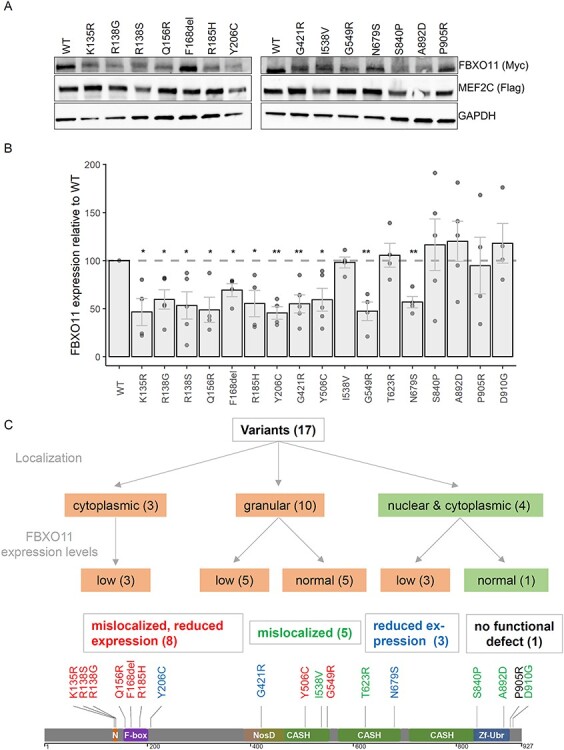
FBXO11 variants affect protein expression levels. (A) Representative image of western blots used for quantification of FBXO11 expression levels is shown. (B) Quantification of FBXO11 protein levels from western blotting. Value of wildtype FBXO11 was set to 100. Experiments were repeated at least 4 times. Individual values are shown as dots with mean values shown as bars with SEM. P-values were calculated using a one sample t-test with the hypothetical mean set to 100 and a significance threshold of < 0.05 (* < 0.05, ** < 0.01). (C) Schematic overview of different functional consequences observed for tested missense variants with schematic drawing of protein with mutations color-coded according to results of functional assays (red: mislocalization and reduced expression, green: mislocalization, blue: reduced protein expression, black: no functional defect observed).