
Figure 4.
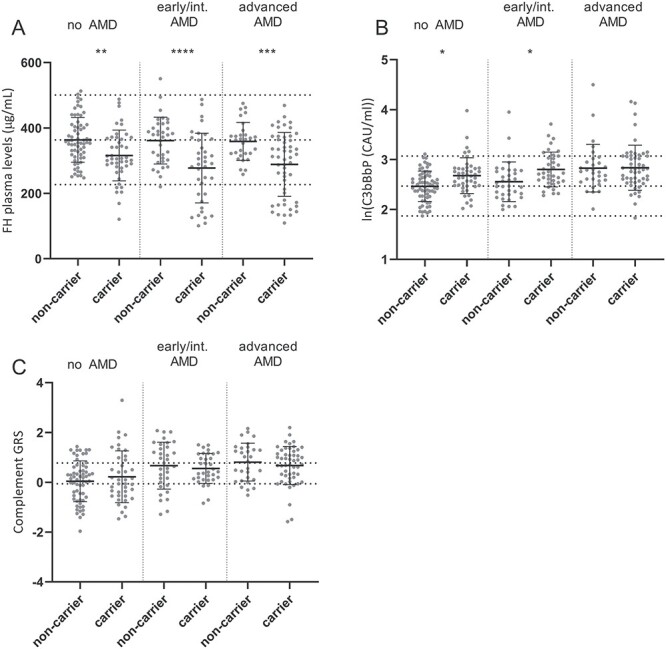
Differences in systemic complement levels and complement GRS in AMD patients and control individuals. (A) FH, (B) C3bBbP levels in plasma and (C) the complement GRS are shown for non-carriers and CFH rare variant carriers stratified by phenotype (no AMD, early/intermediate AMD and advanced AMD). (A–C) Mean and SD are shown by error bars, and (A, B) mean ± 2 SD is indicated by dotted lines. (C) Dotted lines indicate the tertiles of the complement GRS based on a large AMD case–control cohort (de Breuk et al., submitted for publication). Carriers and non-carriers within each AMD stage were compared with one-way ANOVA and Sidak’s multiple comparison test, and significant P-values are indicated with *<0.05, **<0.01, ***<0.001 and ****<0.0001.