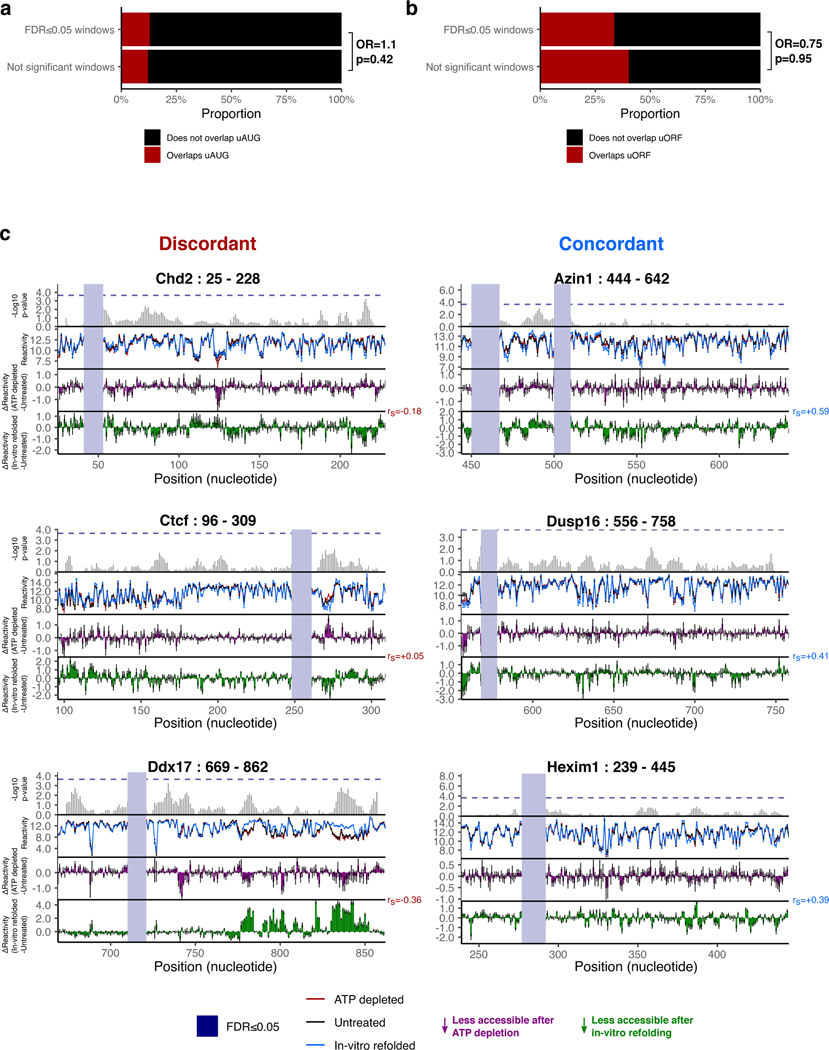
Extended Data Fig. 4. Cellular remodeling hyperconserved 5’UTR RNA structures.
a, Stacked bar plots showing proportions of significant (FDR≤0.05) or not significant windows that overlap uAUG in black versus that do not overlap uAUG in red. OR indicates odds ratio for overlaps uAUG / does not overlap uAUG, and p indicates Fisher’s test p-value (one-sided, Ha=odds ratio>0).
b, Stacked bar plots showing proportions of significant (FDR≤0.05) or not significant windows that overlap uORF in black versus that do not overlap uORF in red. OR indicates odds ratio for overlaps uORF / does not overlap uORF, and p indicates Fisher’s test p-value (one-sided, Ha=odds ratio>0).
c, Zoomed-in view of differential accessibilities along h5UTRs with one or more significantly different windows under ATP depletion. Top plot shows -log10 p-value for each window. Highlighted boxes mark significantly different windows, above the dashed line indicating 5% FDR. Middle plot shows differential accessibility on the y-axis, where greater than zero indicates increased accessibility upon ATP depletion and less than zero indicates decreased accessibility. Bottom plot shows differential accessibility for in vitro refolded RNA. Error bars in each plot show standard error, n=3. The three profiled regions shown on the left side exhibit discordant profiles between accessibility changes observed in cells following ATP depletion and accessibility changes observed for in cell versus in vitro refolded RNA. The other three on the right side exhibit concordant profiles.

