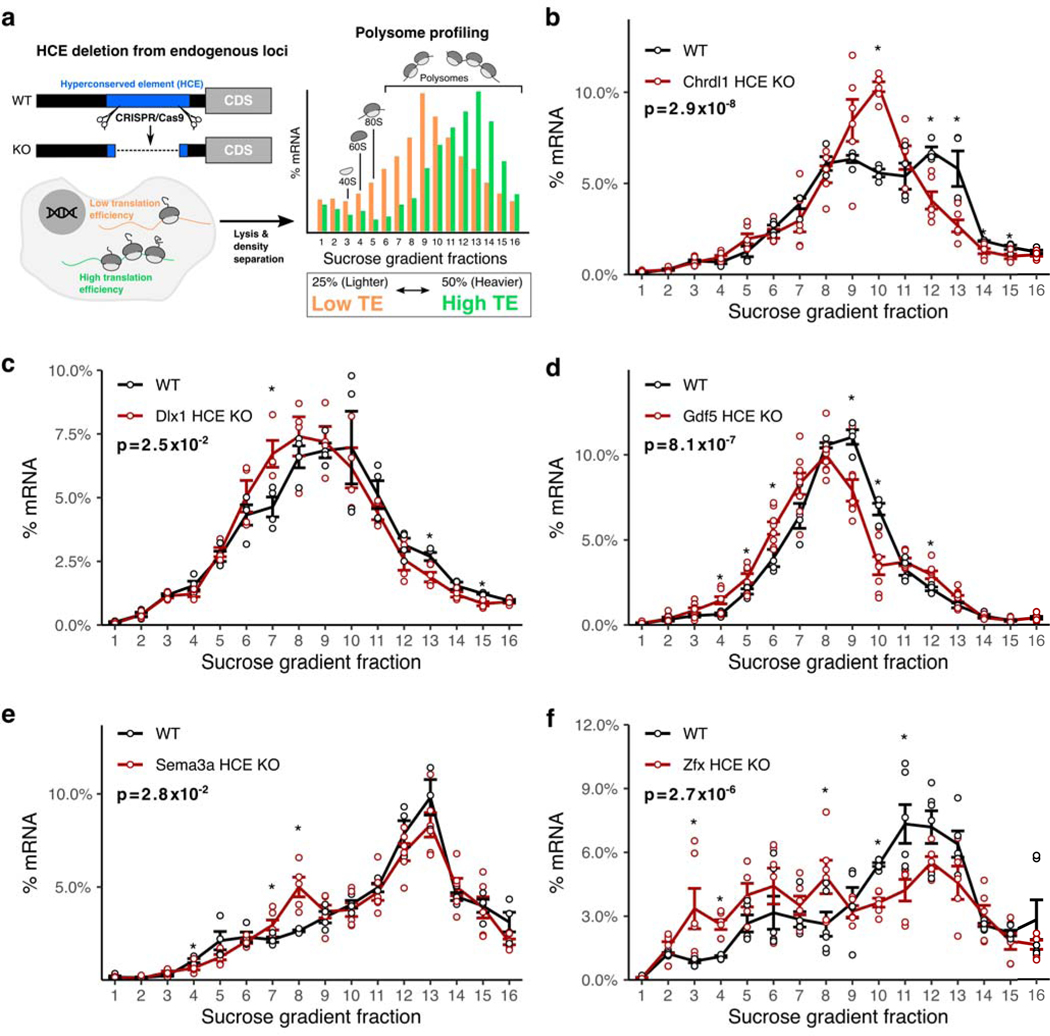
Figure 2 |. Hyperconserved 5’UTRs impact translation efficiency.
a, Schematic of experimental design for testing the impact of hyperconserved 5’UTRs on translation of coding genes. Shift in the distribution of the mRNAs across sucrose gradient fractions towards the right (heavier polysomes) indicates more average ribosome loading and higher translation efficiency, while shift towards the left indicates lower translation efficiency.
b-f, Polysome profiles of wild-type versus hyperconserved element (HCE) knockout cells. Distribution of mRNAs across sucrose gradient fractions are plotted. Y-axis (the line) plots the mean percent mRNA for each fraction. Error bars indicate standard error. Asterisk indicates two-sided t-test p≤0.05 for each fraction between the knockout and the wild-type, n=4. Indicated p-value is calculated by Fisher’s method across all fractions.

