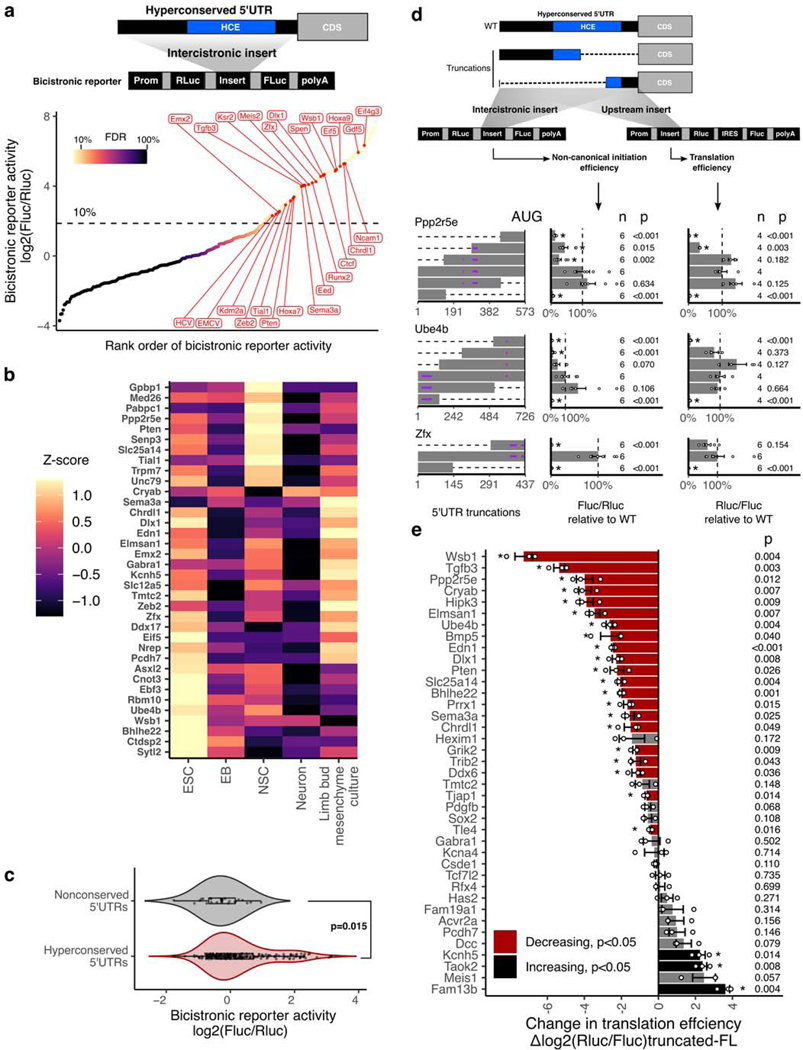
Figure 3 |. Non-canonical translation enhancer in hyperconserved 5’UTRs.
a, Measurement of non-canonical translation initiation activity from 253 hyperconserved 5’UTRs by bicistronic reporter assay. Each dot is a 5’UTR, where x-axis is the maximum luciferase reporter ratio across six different cell types and y-axis is the rank of the reporter ratio from low to high. The skewing is reflective of the bimodal distribution of the activities (see also Extended Data Fig. 2a), and color of the dot indicates estimated proportion of false positives based on mixture modeling of two Gaussian distributions. Dashed line indicates the reporter ratio above which 10% of the hits are expected to be false positives. Genes labeled in red: HCV and EMCV are positive control viral IRES; others are select h5UTRs with annotated biological functions in embryonic development.
b, Heatmap of non-canonical translation initiation activity for 36 significantly varying h5UTRs across five indicated cell types (F-test, FDR≤0.05). N=4 for C10T1/2, mESC and EB; N=6 for NSCs, neurons, limb mesenchyme culture. The color shows row z-scaled mean log2 reporter activities. The 5’UTRs are ordered by clustering similar reporter activity patterns across cell types.
c, Violin plot of bicistronic reporter activities from hyperconserved and non-conserved 5’UTRs in 10T1/2 cells. p indicates two-sided Wilcoxon rank sum test p-value. Box hinges: 25% quantile, median, 75% quantile, respectively from left to right. Whiskers: lower or upper hinge ±1.5*IQR.
d, The effect of various truncations of the h5UTRs on non-canonical initiation and total translation efficiency. Also see Extended Data Fig. 3b. Left: positions of truncations. Dashed lines indicate truncations and bars indicate the remaining sequences. Purple horizontal lines within bars indicate uORFs. Middle: non-canonical initiation efficiency. Right: total translation efficiency. X-axis indicates the geometric mean of luciferase reporter ratios relative to the wild-type. Error bars indicate geometric standard error. Dashed line marks the reporter ratio for the wild-type 5’UTR. Asterisk indicates two-sided t-test p≤0.05 for each truncation mutant versus the full-length wild-type. The numbers to the left of the bars indicate exact n and p-values for each comparison versus the full-length.
e, Comparison of translational activities between the full-length h5UTR versus the only first 300nt of the h5UTR. 38 different pairs are tested. X-axis indicates the mean log2 luciferase reporter ratios of each truncation relative to its full-length wild-type. Error bars indicate standard error of the log2 luciferase activity ratios. Bars colored in red indicate significantly reduced translation in the shorter, truncated 300nt fragment; black indicates significant increase (two-sided t-test, p≤0.05, paired n=3, marked by asterisk). The numbers to the left of the bars indicate exact p-values for each comparison versus the full-length.

