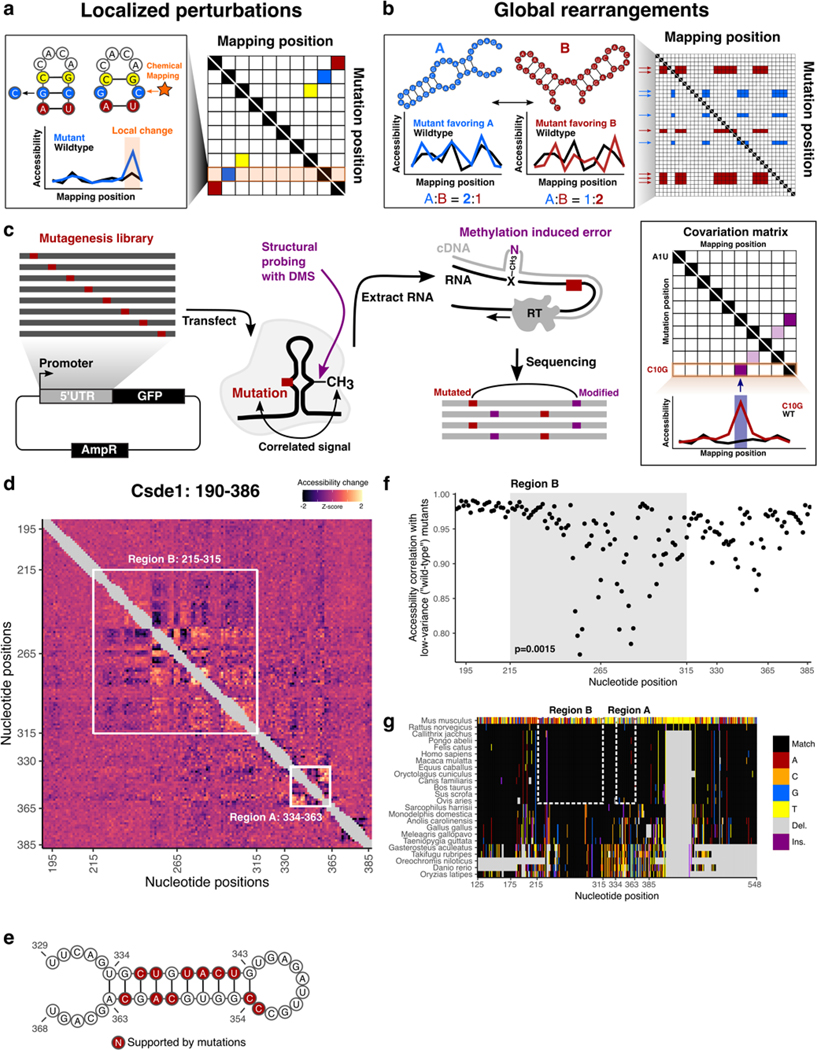
Figure 5 |. icM2 reveals structured elements in the hyperconserved Csde1 5’UTR.
a, Schematic of localized perturbation patterns that may be observed in M2 data. Here, the mutant does not disrupt the overall structure and “releases” its base pairing partner. This results in an increase of chemical accessibility signal at the interacting nucleotide. Systematic profiling of accessibilities by M2 results in an array of such mutant accessibility data into an approximate contact map.
b, Schematic of global rearrangement patterns that may be observed in M2 data. Here, multiple conformations of the RNA molecule are present together in an ensemble at non-negligible relative proportions. Mutations can shift this balance, such that one structural state is favored over the other. In this case, M2 reveals large-scale accessibility perturbations across a longer stretch of the RNA molecule. Multiple mutations often impact the relative proportions in similar ways, which manifests as correlated arrays accessibility changes in M2 data matrix.
c, Schematic of the icM2 method. Mutagenesis library of the target RNA of interest is first generated using error-prone PCR followed by cloning into an expression vector. The cells are transfected with the library and treated with DMS. Total RNAs are extracted. Read-through reverse transcription encodes DMS-modified nucleotides as mutations on the cDNA, which are read out by high-throughput sequencing. Correlated mutations in sequencing reads are then quantified and the resultant covariation matrix is analyzed for signature perturbation patterns.
d, Heatmap of icM2 accessibility matrix for Csde1 5’UTR from position 190 to 386. For each row, the chemical mapping profile of a single-nucleotide variant of the RNA is plotted across the columns, where the colors indicate z-scaled accessibility change values from the wild-type RNA. 1D data from each mutant are vertically stacked to display a 2D matrix. White boxes mark the two regions (A: positions 334–363 and B: positions 215–315) that display strong perturbation signals that reveal their structures.
e, A structure model (structure W) of region A. Bases colored in red indicate mutations with accessibility changes observed in icM2 data that are consistent with the model.
f, Scatter plot showing correlations of per-nucleotide accessibilities between each mutant versus the “wild-type” (wild-type accessibilities are not directly measured, but mean accessibilities of 10 lowest variable mutants are used as a close approximation) on the y-axis and nucleotide positions along the x-axis. p indicates two-sided Wilcoxon rank sum test p-value for the difference in distributions of correlations between region B versus other nucleotides.
g, Multiple species alignment for Csde1 5’UTR from position 125 to 548. For each row, the sequence alignment of a species is plotted across the columns, where the colors indicate match/substitution/insertion/deletion at each nucleotide. The alignment positions are relative to the mouse sequence. The top row is the mouse alignment, colored separately from other rows as a reference to indicate the identity of the bases in each position in the multiple species alignment.

