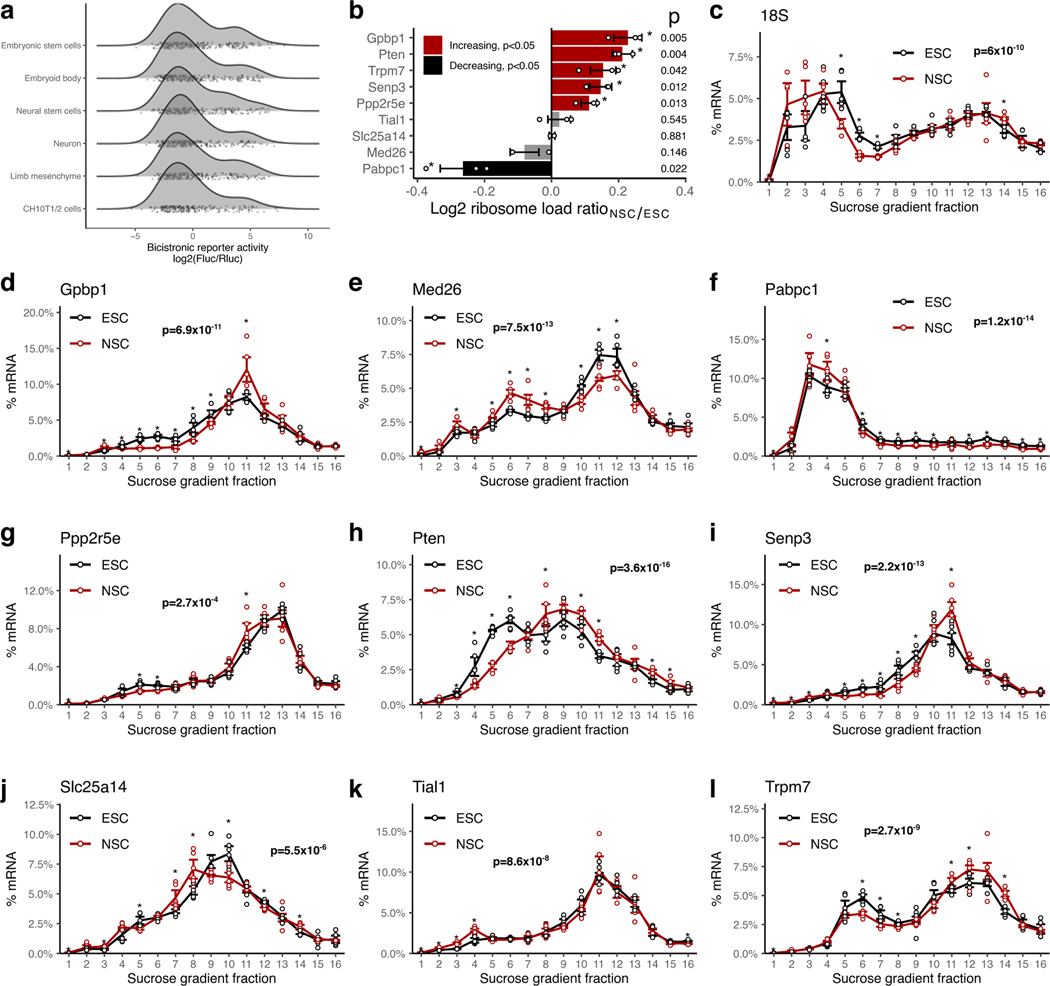
Extended Data Fig. 2. Non-canonical translation activation by hyperconserved 5’UTRs across cell types.
a, Density plots of non-canonical translation initiation activities from h5UTRs by bicistronic reporter assay. X-axis is the luciferase reporter activity ratios. Jittered dots mark individual reporter ratios for each h5UTR in each cell type.
b, Summarized plot of ribosome load (sum of % mRNA times the ribosome number for each fraction) differential ratio between NSCs and ESCs calculated from polysome profiles for each gene shown in Extended Data Figs. 2c–l. Red indicates significant increase in NSCs and black indicates significant decrease (two-sided t-test p≤0.05, n=3, marked by asterisk).
c-l, Endogenous polysome profiles of NSCs versus ESCs for genes with h5UTRs that show high non-canonical translation reporter activities in NSCs compared to ESCs. Distribution of mRNAs across sucrose gradient fractions are plotted. Y-axis plots the mean percent mRNA. Error bars indicate standard error. Asterisk indicates two-sided t-test p≤0.05 for each fraction between the two cell types. n=3 for each cell type. Indicated p-value (pf) is calculated by Fisher’s method across all fractions. Note that Extended Data Fig. 2c shows the profile of 18S rRNA, which indicates lower global translation in NSCs compared to ESCs.

