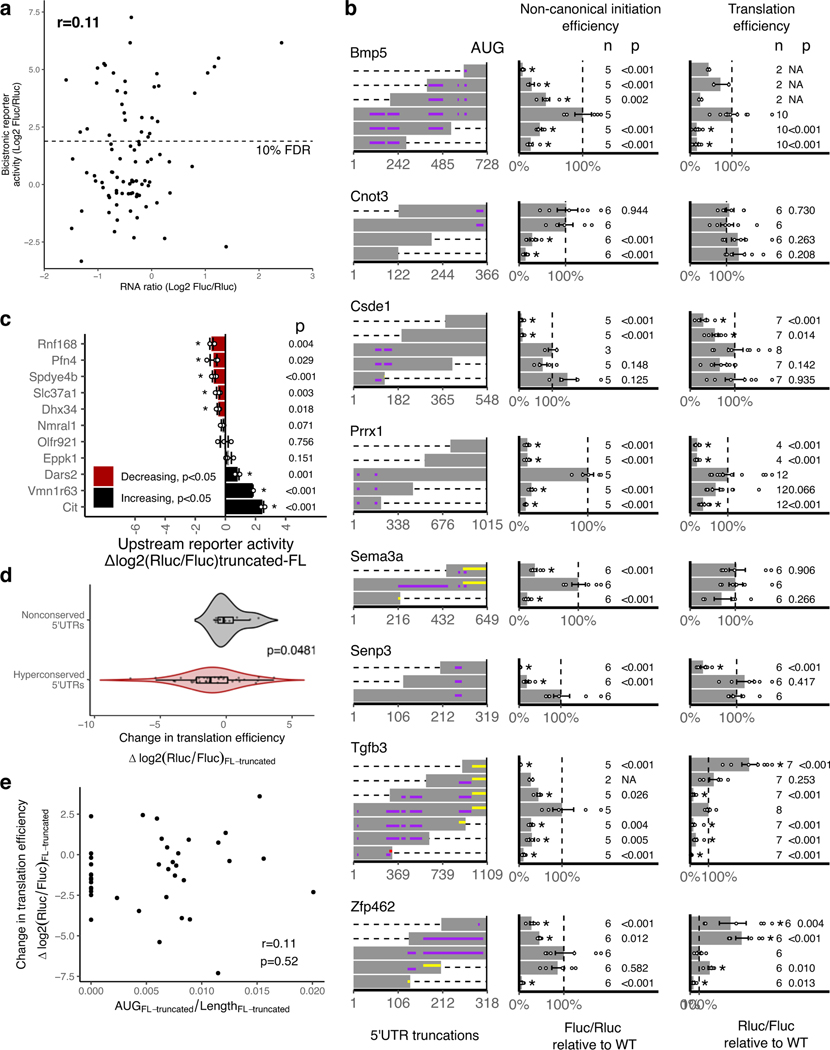
Extended Data Fig. 3. Non-canonical activation by hyperconserved 5’UTRs significantly contributes to translation.
a, Scatter plot of luciferase activity versus RNA level ratios (mean from n=3) observed for the bicistronic reporters of 90 h5UTRs measured in 10T1/2 cells. Dashed line marks the 10% FDR used in Fig. 3a. Spearman correlation indicated on top left.
b, The effect of various truncations of the h5UTRs on non-canonical initiation and total translation efficiency (also see Fig. 3d). Left: positions of truncations. Dashed lines indicate truncations. Purple horizontal lines indicate uORFs; yellow and red lines indicate in-frame and out-of-frame uAUGs, respectively. Middle: non-canonical initiation efficiency. Right: total translation efficiency. X-axis indicates the mean of luciferase reporter ratios relative to the wild-type. Error bars indicate standard error. Dashed line marks the wild-type 5’UTR activity. Asterisk indicates two-sided t-test p≤0.05 for each truncation versus the full-length. The numbers to the left of the bars indicate n and p-values.
c, Comparison of translational activities between the full-length long, non-conserved 5’UTRs versus the only first 300nt truncation. 11 different pairs are tested. X-axis indicates the mean log2 luciferase reporter ratios of each truncation relative to its full-length wild-type. Error bars indicate standard error. Bars colored in red indicate significantly reduced translation in the shorter, truncated 300nt fragment; black indicates significant increase (two-sided t-test, paired n=3, p≤0.05, marked by asterisk). The numbers to the left of the bars indicate p-values.
d, Violin plot of full-length/truncated reporter activity ratios (log2) from hyperconserved and non-conserved 5’UTRs. p indicates two-sided Wilcoxon rank sum test p-value. Box hinges: 25% quantile, median, 75% quantile, respectively from left to right. Whiskers: lower or upper hinge ±1.5*IQR.
e, Scatter plot of change in translation efficiency between full-length and truncated h5UTRs shown in Fig. 3e versus change in uAUG density (change in number of AUGs / change in length between each pair of full-length and truncated h5UTRs). r indicates pearson’s correlation coefficient and p indicates two-tailed p-value.

