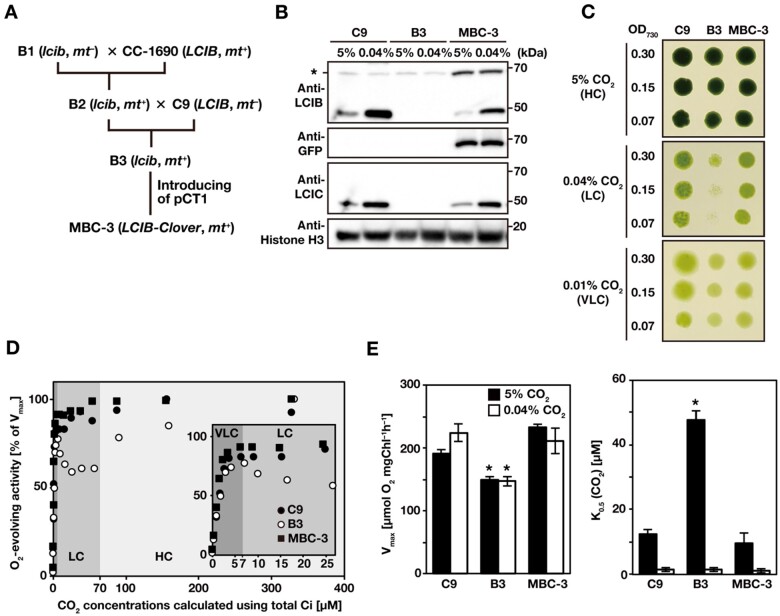
Figure 1.
Isolation and characterization of LCIB-Clover expressing strain. A, Strategy to obtain the LCIB-Clover-expressing strain, MBC-3, by the genetic crossing of lcib-insertion mutant with WT strains (CC-1690 and C9) and introduction of the expression plasmid pCT1. mt–, mating type minus; mt+, mating type plus. B, Accumulation of LCIB, LCIC, and LCIB-Clover fusion proteins in C9, B3, and MBC-3 cells. Cells were grown in liquid culture aerated with 5% CO2 or 0.04% CO2 for 12 h. Histone H3 was used as a loading control. The asterisk indicates non-specific bands from C9 and B3 cells, which appeared at the same molecular weight as LCIB-Clover. kDa, kilo Dalton. C, Spot tests for the growth of C9, B3, and MBC-3 cells. Cell suspensions were diluted to the indicated optical density at 730 nm, and 3 µL of each diluted cell suspension was spotted onto MOPS-P agar plates and incubated in HC (5% CO2) conditions for 4 d, LC (0.04% CO2) conditions for 5 d, or VLC (0.01% CO2) conditions for 8 d. D, Typical responses of net O2-evolving activities of C9 (closed circles), B3 (open circles), and MBC-3 cells (closed squares) against calculated CO2 concentrations at pH 7.8 for the ranges of 0–400 µM CO2 and 0–27.5 µM CO2 (inset). Shaded areas represent different physiological CO2-acclimation states of Chlamydomonas: VLC (<7 µM CO2; dark gray), LC (7–70 µM; medium gray), and HC (>70 µM CO2; light gray). CO2 concentrations were calculated from the concentration of Ci added, assuming that CO2 and are in equilibrium due to the activity of CA localized in the periplasmic space. Before measurements, cells were grown in the liquid culture aerated with 0.04% CO2 for 12 h. E, Vmax and K0.5 (CO2) values. The CO2 concentration required for the half-maximal rate of Vmax of C9, B3, and MBC-3 cells was calculated from the O2-evolving activities in D. Data in all experiments are mean values ± standard deviation from three or four biological replicates. *P-value < 0.01, Student’s t test.

