Figure 4.
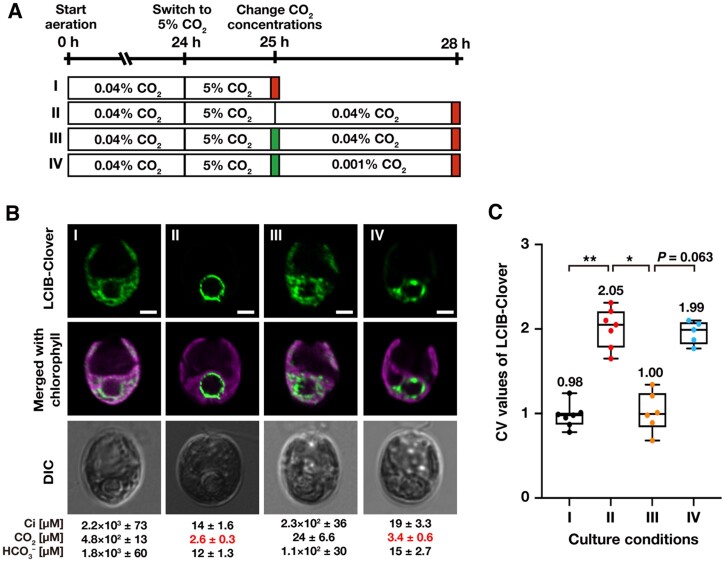
Effect of photosynthetic electron flow on the relocation of LCIB-Clover. A, Schematic of the liquid culture conditions. MBC-3 cells were cultured in medium aerated with 0.04% CO2 for 24 h, which was replaced with the fresh medium aerated with 5% CO2 for 1 h (indicated as I to the left of the white box). After aeration with 5% CO2 for 1 h, MBC-3 cells were transferred to fresh medium aerated with 0.04% for 3 h without the addition of DCMU (II), with the addition of DCMU (III), or medium aerated with 0.001% CO2 with DCMU (IV). Red and green boxes indicate the time of observation and addition of DCMU, respectively. For all culture conditions, the pH of the medium was 7.0. B, Representative LCIB-Clover fluorescence images of MBC-3 cells. Roman numerals correspond to the culture conditions indicated in A. Ci concentrations in the culture medium were measured using gas chromatography, and the calculated CO2 and concentrations are shown below the images. CO2 concentrations shown in red indicate VLC (<7 µM CO2) conditions. DIC, differential interference contrast image. Scale bars: 2 μm. C, Quantification of localization patterns of LCIB-Clover. Roman numerals correspond to the culture conditions indicated in A. The CV value of the fluorescence intensity was calculated in each cell to quantify LCIB-Clover localization. The median values derived from the analysis of MBC-3 cells are represented with error bars depicting the interquartile range (n = 5–7). Dunn's multiple comparisons test was used to assess the statistical significance of LCIB-Clover localization between the different conditions. *P-value < 0.05; **P-value < 0.005, Kruskal–Wallis test with Dunn’s multiple comparison.

