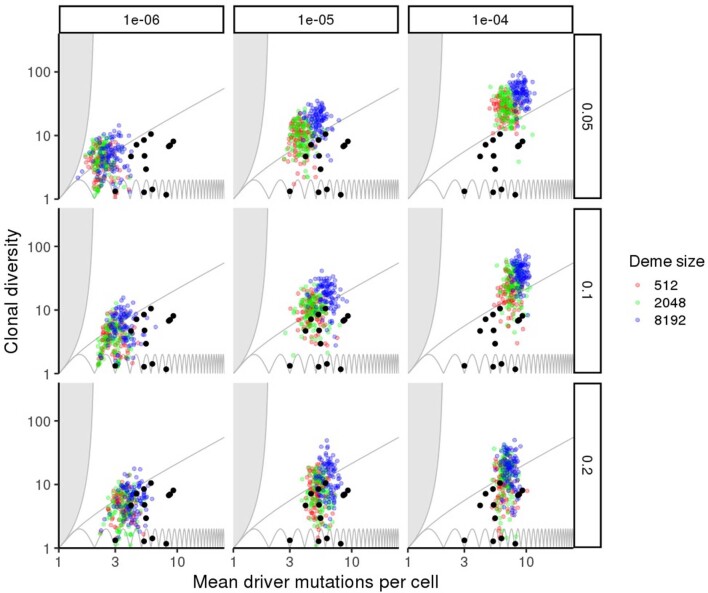
Extended Data Fig. 5. Variation in evolutionary indices D and n for an invasive glandular model with cell dispersal throughout the tumour and at the tumour boundary.
Results are shown for varied gland size (colours), driver mutation rate (columns) and average driver fitness effect (rows), with 100 stochastic simulations per model. Black points show values derived from multi-region sequencing of kidney cancers, lung cancers and breast cancers. Non-varied parameter values are the same as in Fig. 2.

