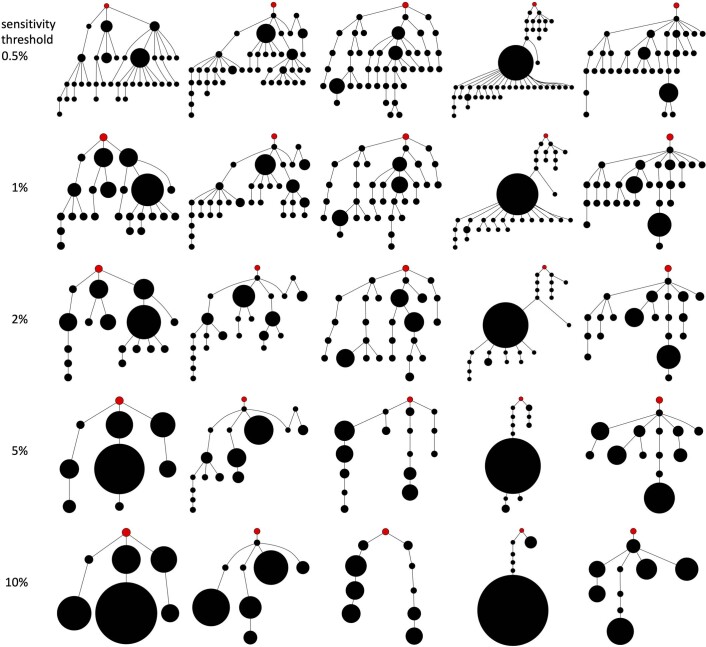
Extended Data Fig. 7. Driver phylogenetic trees resulting from an evolutionary model with cell dispersal throughout the tumour and at the tumour boundary (512 cells per gland).
The rows show final outcomes of the same five simulations (in the same order) after adjustment to simulate different sensitivities in detecting rare mutations. Driver mutations with frequency below the sensitivity threshold are removed from the model output. This means that if the combined frequency of a clone and its descendants is below the sensitivity threshold then the clone is merged with its parent clone. The sensitivity threshold is varied from 0.5% (top row) to 10% (bottom row). Node size corresponds to clone population size and the founding clone is coloured red.

