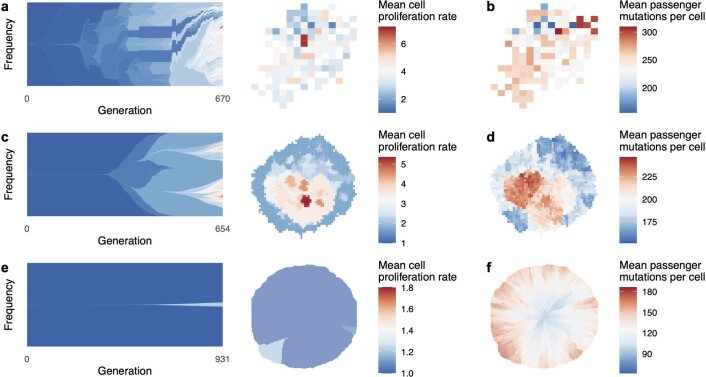
Extended Data Fig. 1. Cell proliferation rates and mutation burdens.
a, Evolution and final spatial distribution of cell proliferation rates, for a model of tumour growth via gland fission (8,192 cells per gland). b, Final spatial distribution of mutation burdens. c-d, Results of a model in which tumour cells disperse between neighbouring glands and invade normal tissue (512 cells per gland). e-f, Results of a boundary-growth model of a non-glandular tumour. In all cases, the driver mutation rate is 10−5 per cell division, and driver fitness effects are drawn from an exponential distribution with mean 0.1. Other parameter values are listed in Supplementary Table 4.

