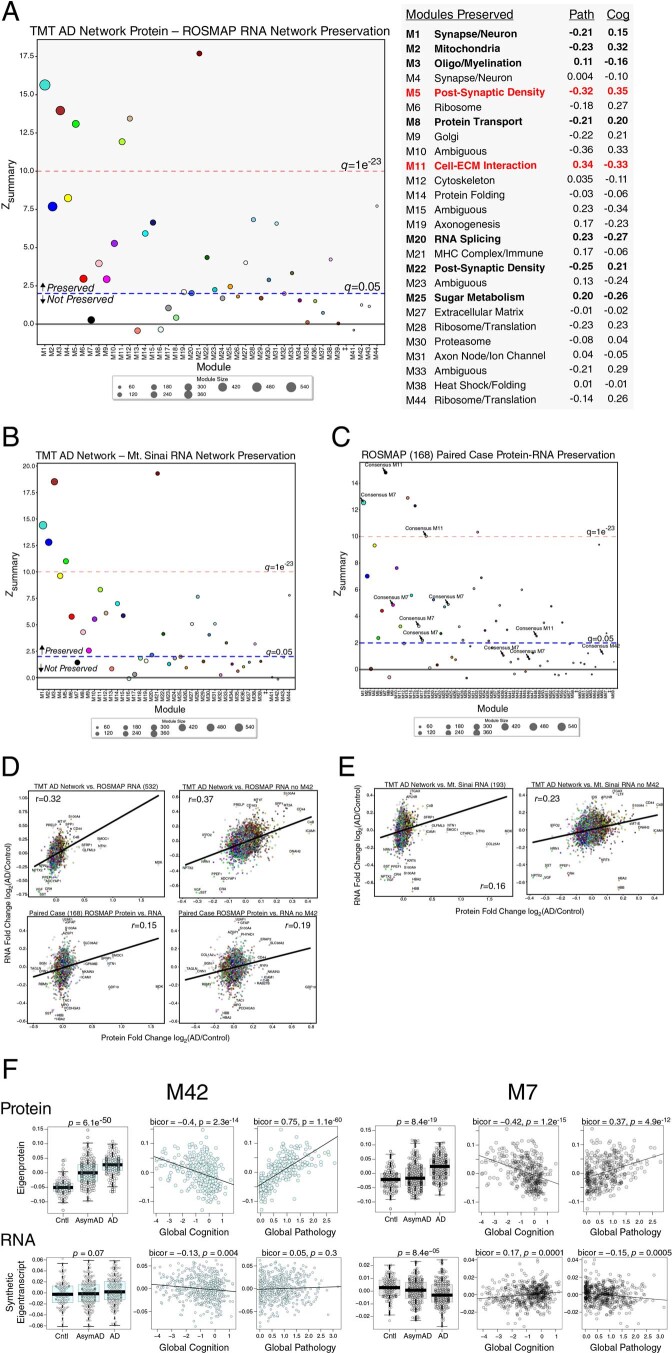
Extended Data Fig. 5. TMT AD Network Module Preservation in RNA Networks.
(a–f) Module preservation of the TMT AD protein network into the ROSMAP RNA network (A). Modules that had a preservation Zsummary score less than 1.96 (q > 0.05) were not considered to be preserved. Modules that had a Zsummary score of greater than or equal to 1.96 (or q = 0.05, blue dotted line) were considered to be preserved, while modules that had a Zsummary score greater than or equal to 10 (or q = 1e−23, red dotted line) were considered to be highly preserved. TMT AD network modules that were preserved in the RNA network, along with their correlation to global pathology and global cognition traits in ROSMAP, are listed on the right. (b) Module preservation of the TMT AD protein network into the Mt. Sinai RNA network. (c) Module preservation of the ROSMAP 168 protein network into the paired case RNA network. AD protein network module assignments are provided for M7, M11, and M42. Additional module assignments are provided in Supplementary Table 21. (d) Correlation of AD versus control RNA and protein levels between the TMT protein and ROSMAP RNA (n = 532 cases) networks (top), as well as between cases paired between protein and RNA in ROSMAP (n = 168), including (left) or excluding (right) M42 proteins. (E) Correlation of AD versus control RNA and protein levels between the TMT protein and Mt. Sinai RNA (n = 193 cases) networks, including (left) or excluding (right) M42 proteins. Correlations were performed using Pearson correlation. (f) Comparison of M42 matrisome (left) and M7 MAPK/metabolism (right) eigenprotein (top; n = 106 control, 200 AsymAD, 182 AD, Total=488) and synthetic eigentranscript (bottom; n = 125 control, 204 AsymAD, 203 AD, Total=532) in ROSMAP cases levels by case status, and correlation with global pathology (n = 328 eigenprotein, 532 eigentranscript) and global cognitive function (n = 328 eigenprotein, 529 eigentranscript) in ROSMAP. Differences were assessed by one-way ANOVA. Correlations were performed using bicor. Boxplots represent the median, 25th, and 75th percentiles, and box hinges represent the interquartile range of the two middle quartiles within a group. Datapoints up to 1.5 times the interquartile range from box hinge define the extent of whiskers (error bars).

