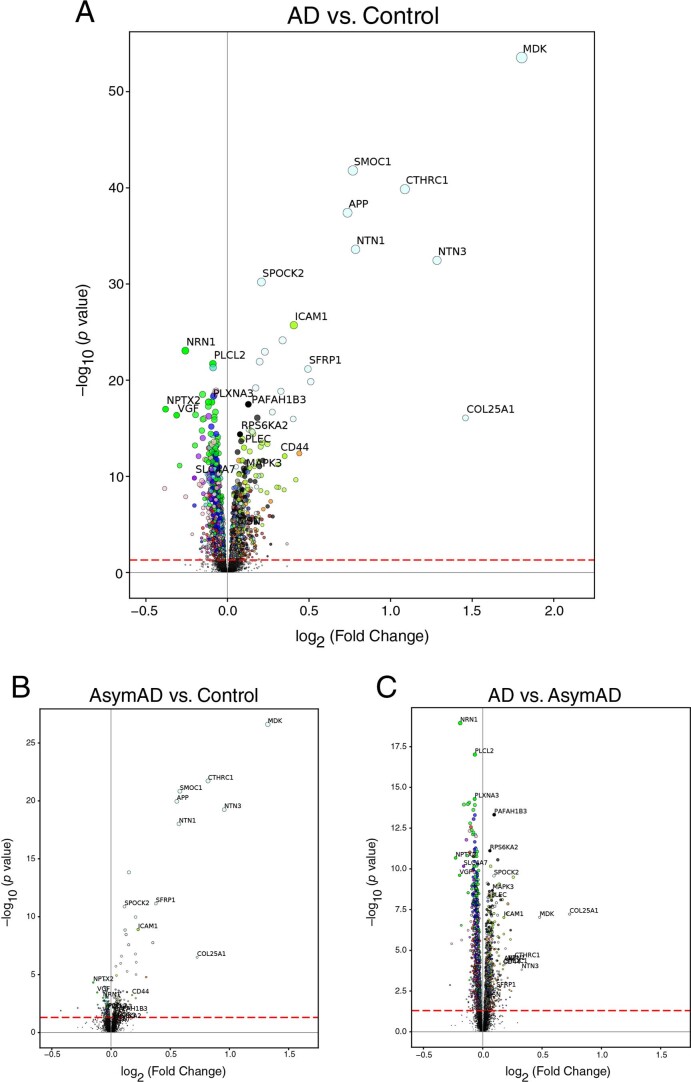
Extended Data Fig. 6. TMT AD Network Protein Differential Expression.
(a–c) Differential expression between AD versus control (a), AsymAD versus control (B), and AsymAD versus AD (c). The dashed red line indicates a P value of 0.05, above which proteins are considered significantly differentially expressed. Proteins are colored by the network module in which they reside, according to the module color scheme provided in Fig. 1b. Proteins in the M42 matrisome module are colored lightcyan. One-way ANOVA followed by two-tailed pairwise test was used to calculate P values. Significance was adjusted by the Holm procedure. Fold change and statistics for all proteins are provided in Supplementary Table 2.

