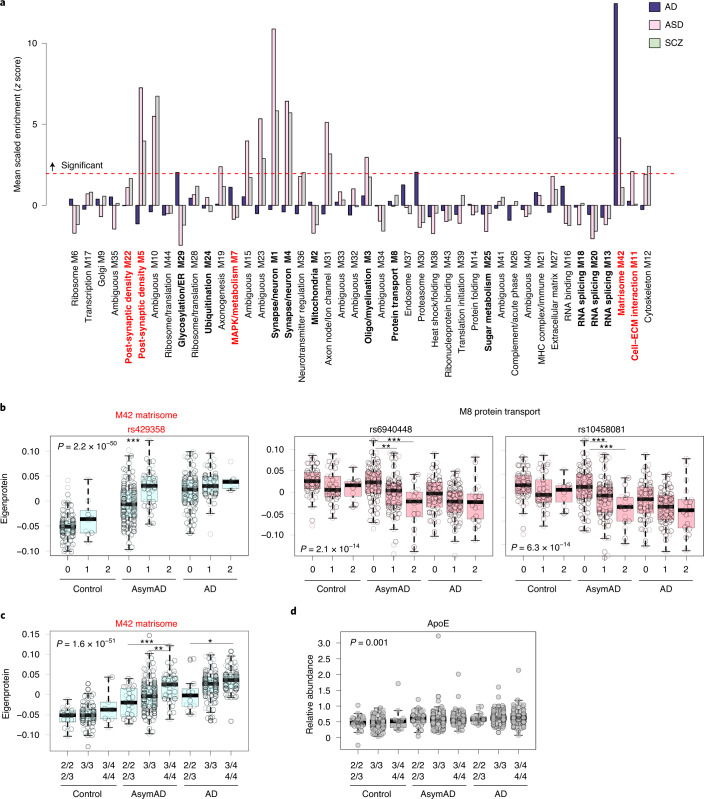
Fig. 4. The M42 matrisome module is enriched in AD genetic risk and is increased by APOE ε4.
a, b, Enrichment of AD genetic risk factor proteins as identified by GWAS in TMT AD network modules (a). The dashed red line indicates a Z score of 1.96 (P = 0.05), above which enrichment was considered significant. Enrichment in M42 is driven by ApoE. Modules are ordered by relatedness as illustrated in Fig. 1b. b, Module eigenprotein levels by allele dose (0, 1, 2) for the three SNPs identified as proximal mod-QTLs, separated by case status. M42 rs429358 AsymAD (0, 1) P = 6.9 × 10–07; M8 rs6940448 AsymAD (0,1) P = 0.003, AsymAD (0, 2) P = 5.5 × 10⁻⁶; M8 rs10458081 AsymAD (0, 1) P = 0.0007, AsymAD (0, 2) P = 6.7 × 10⁻⁵. M42 rs429358 n = 93 control (0), 10 control (1), 138 AsymAD (0), 43 AsymAD (1), 95 AD (0), 51 AD (1), 5 AD (2). M8 rs6940448 n = 52 control (0), 40 control (1), 11 control (2), 80 AsymAD (0), 81 AsymAD (1), 20 AsymAD (2), 60 AD (0), 70 AD (1), 21 AD (2). M8 rs10458081 n = 52 control (0), 40 control (1), 11 control (2), 77 AsymAD (0), 85 AsymAD (1), 19 AsymAD (2), 61 AD (0), 70 AD (1), 20 AD (2). c, M42 matrisome module eigenprotein levels by APOE genotype, separated by case status. AsymAD 2/2 or 2/3 to 3/4 or 4/4 P = 0.0002; AsymAD 3/3 to 3/4 or 4/4 P = 0.005; AD 2/3 to 3/4 or 4/4 P = 0.01. Control n = 20 (2/2 or 2/3), 75 (3/3), 10 (3/4 or 4/4); AsymAD n = 26 (2/2 or 2/3), 122 (3/3), 45 (3/4 or 4/4); AD n = 15 (2/3), 97 (3/3), 66 (3/4 or 4/4). d, ApoE levels by APOE genotype, separated by case status. ApoE is increased in AsymAD and AD, but APOE genotype does not affect ApoE levels. Control n = 20 (2/2 or 2/3), 75 (3/3), 10 (3/4 or 4/4); AsymAD n = 26 (2/2 or 2/3), 122 (3/3), 45 (3/4 or 4/4); AD n = 15 (2/3), 97 (3/3), 66 (3/4 or 4/4). Full statistics are provided in Supplementary Table 26. Differences in eigenprotein levels were assessed by one-way ANOVA with Tukey test. Only significant differences within case status group are shown. *P < 0.05, **P < 0.01 and ***P < 0.001. Box plots represent the median and 25th and 75th percentiles, and box hinges represent the interquartile range of the two middle quartiles within a group. Data points up to 1.5 times the interquartile range from the box hinge define the extent of whiskers (error bars). MHC, major histocompatibility complex.

