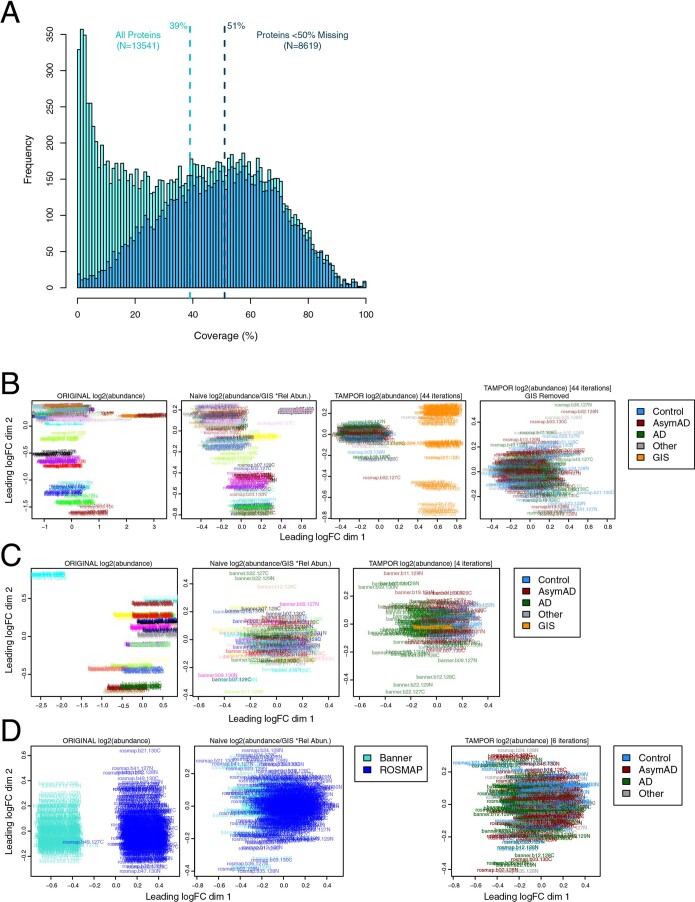
Extended Data Fig. 1. Percent Protein Coverage by TMT-MS and TMT-MS Batch Correction.
(a) Percent protein coverage for all proteins measured (n = 13,541) and those measured in at least 50% of cases (n = 8,619), which was the threshold for inclusion in the co-expression network. The vertical dashed lines represent median percent coverage for each distribution. (b–d) TMT-MS batch correction as illustrated by multidimensional scaling (MDS). Starting log2 abundance, log2 abundance divided by the global internal standard (GIS), and additional batch correction by the TAMPOR algorithm in the ROSMAP cohort (b) and the Banner cohort (c) separately, followed by final cohort correction (d). Each batch is designated an arbitrary color in the first two panels in (b) and (c). dim, dimension; logFC, log fold change.

